


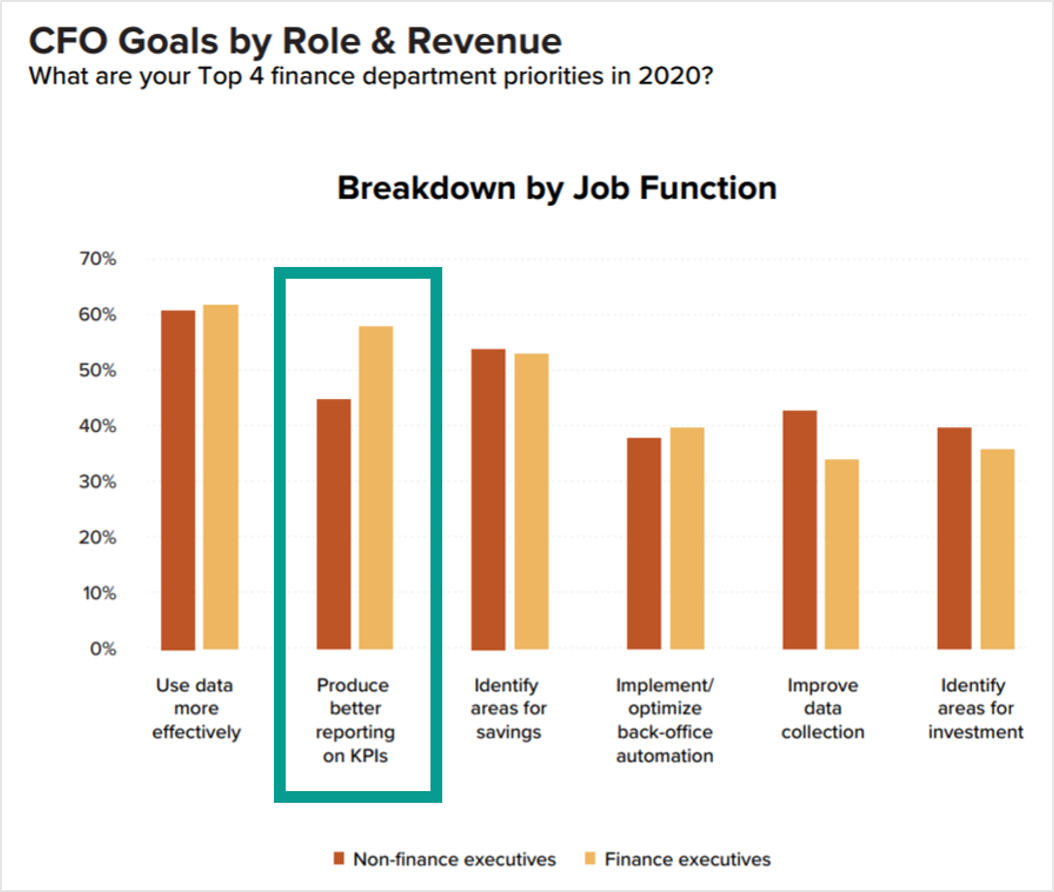
In their Winter 2020 Business Leader Outlook Survey, NetSuite Brainyard researchers suggest a disproportionate prioritization by finance executives on descriptive analytics when compared to non-finance peers:
Finance executives were 29% more likely to list better KPI reporting as a priority than their non-finance counterparts. Our take is that what non-finance executives would really like is for the finance department to build data into a narrative rather than just throw KPI results over the wall.
Storytelling with Data
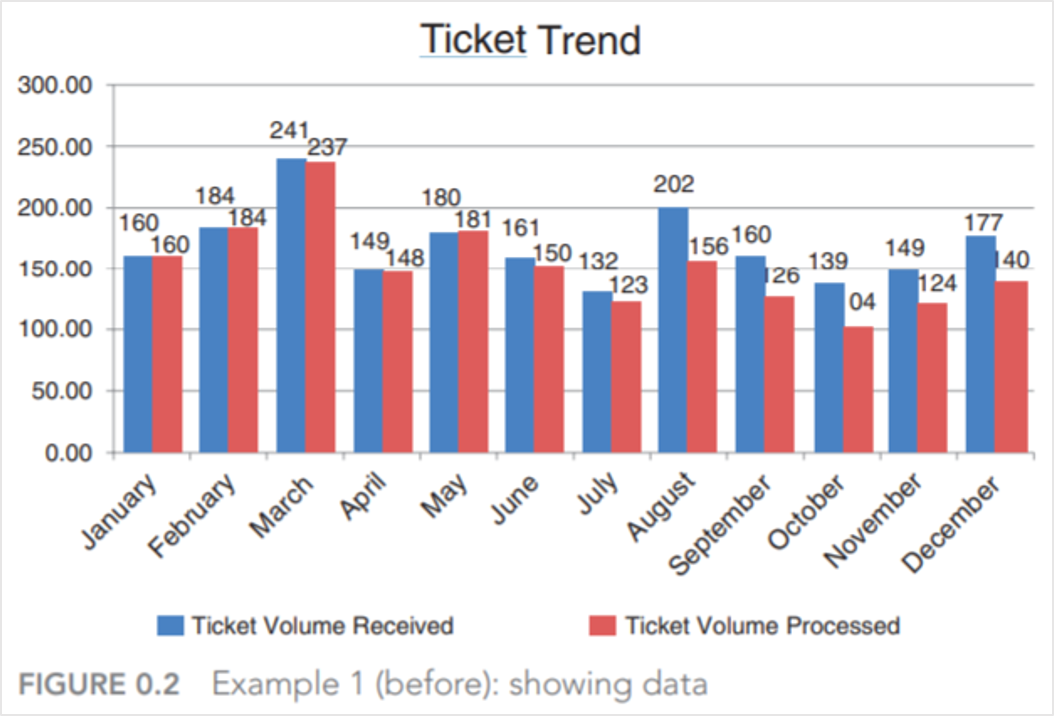
For those familiar with the work of Cole Nussbaumer Knaflic, founder and CEO of company and book Storytelling with Data, this concept may resonate. Knaflic advocates for the sharing of data through visually rich narratives that ask their audiences to evaluate specific actions rather than simply showing data. For example, consider the difference between the below two charts depicting the same data on declining support ticket processing:
Before (no narrative or call to action):
After (clear call to action based on a data-driven narrative):
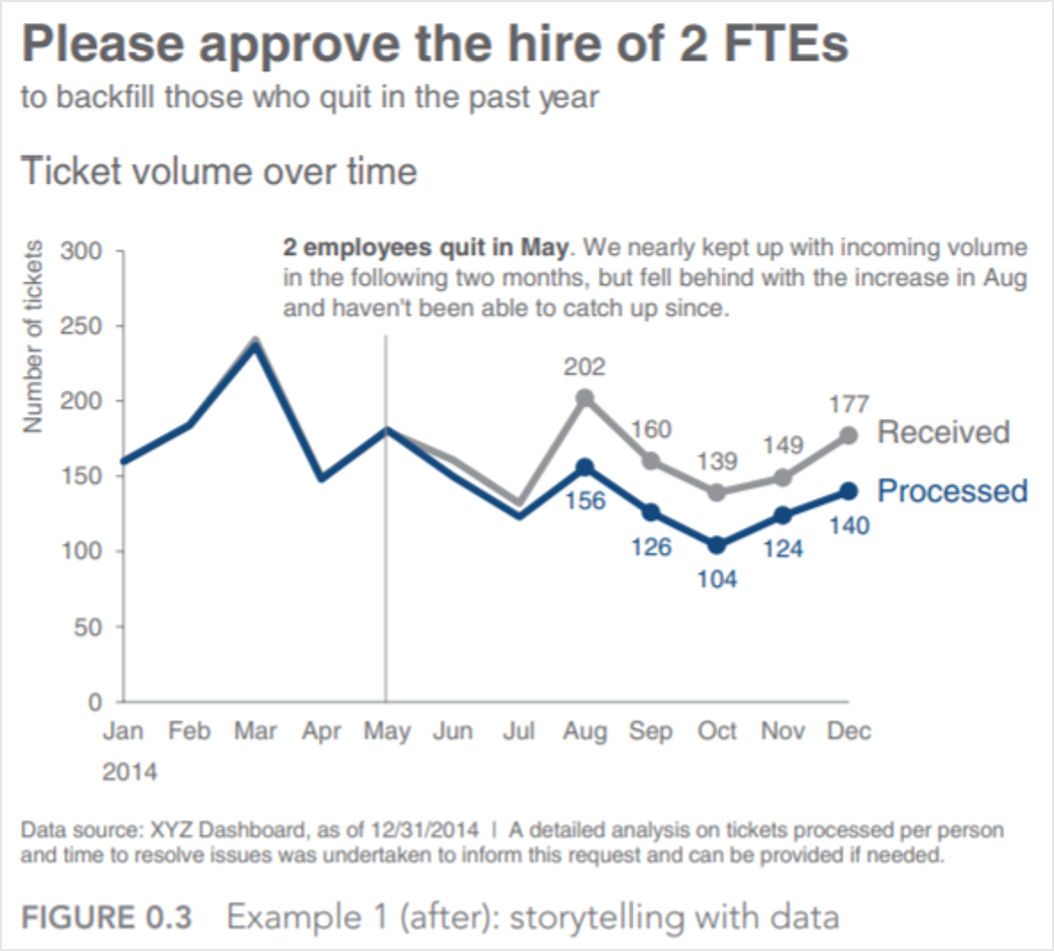
In Knaflic’s view, descriptive analytics is merely a starting place for the more valuable higher-order analytics that then must follow. Or, in the case of NetSuite Brainyard’s survey results, not just better reporting on KPIs but specifically better reporting on KPIs that explains (1) why the numbers are the way they are and (2) what we can do about it.
Gartner Analytic Ascendancy Model
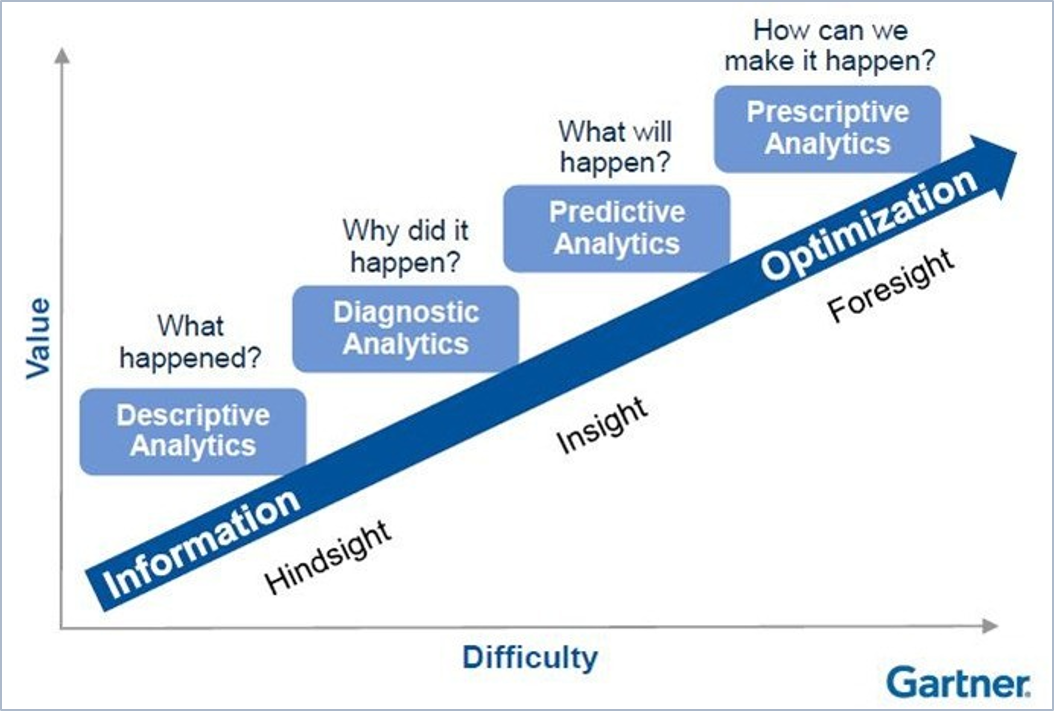
This isn’t to suggest that diagnostic analytics is without challenges of its own. Indeed, Gartner’s Analytic Ascendency Model proposes a direct relationship between the value and difficulty of different orders of analytics.
Descriptive analytics can sometimes be as simple as the facts—the data is what it is. However, ascending to diagnostic analytics requires associating those facts with outcomes. An issue with either (1) the determination of the facts or (2) the association of those facts with outcomes can lead to suboptimal decisions.
The 2020.1 SuiteAnalytics Workbook Update
I was therefore pleased to see that NetSuite’s 2020.1 release includes updates to the SuiteAnalytics Workbook that reduce the difficulty and risk of diagnostic analytics.
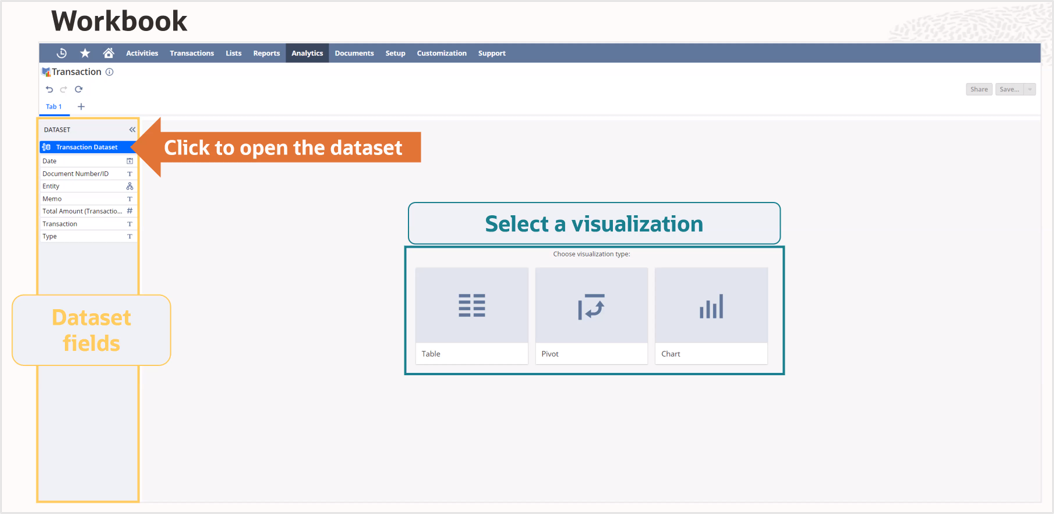
In my view, the single best update was to separate the building of the datasets from their associated visualizations. This separation provides three benefits:
- A single source of truth
- Reduced barriers to entry for visualizations
- Introduction to the Table view
Let’s break these down one by one:
1) A single source of truth
Prior to 2020.1, a SuiteAnalytics Workbook included both its source data and its associated pivots and charts in the same object. With 2020.1, workbooks and datasets exist as separate objects. In a dataset, you define the source data, including record types, fields, and criteria. In a workbook, you visualize and interrogate data using tables, pivots, and charts.
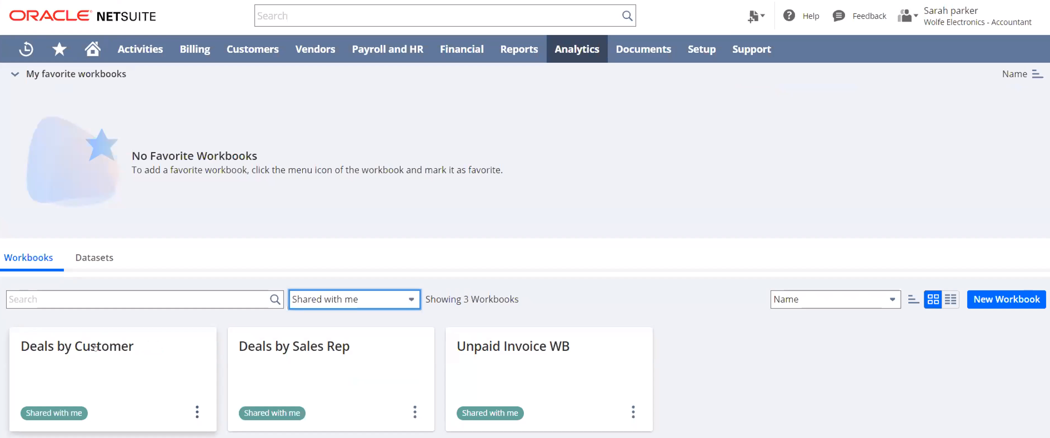
By separating workbooks and datasets, a single dataset can feed multiple workbooks. This leads to a reduction in the number of workbooks and an increase in the consistency of the data upon which analyses are based. Further, changes to a single dataset automatically propagate to all associated workbooks.
2) Reduced barriers to entry for visualizations
Before 2020.1, a user had to not only know how to assemble a visualization but also how to assemble the data feeding that visualization. By separating the two processes with 2020.1, a power user can now assemble complete, accurate, and rich datasets that multiple users can use for analysis.
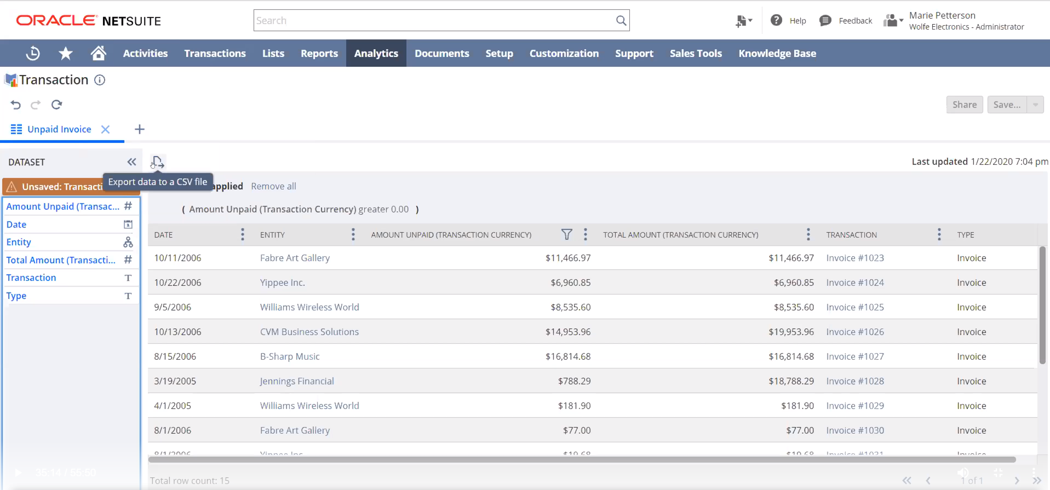
3) Introduction to the Table view
Prior to 2020.1, there wasn’t a way to explore the dataset in a tabular view without impacting the charts and pivots associated with the dataset. The introduction of the Table view means we can explore a workbook’s source data without editing the associated dataset and without impacting our visualizations. We also don’t have to worry about defining fields from joined records or custom formulas a second time.
Wrap Up
NetSuite’s 2020.1 release for the SuiteAnalytics Workbook is just as impressive as the last, especially the decision to separate the dataset from the workbook. If you’re still getting caught up on this new tool, consider checking out the advances that were made in the 2019.2 release. Those updates made building sophisticated datasets even easier.
If you would like more information about NetSuite, please contact us at any time. You can also learn more great tips for NetSuite on our YouTube playlist and other blog posts.
This publication contains general information only and Sikich is not, by means of this publication, rendering accounting, business, financial, investment, legal, tax, or any other professional advice or services. This publication is not a substitute for such professional advice or services, nor should you use it as a basis for any decision, action or omission that may affect you or your business. Before making any decision, taking any action or omitting an action that may affect you or your business, you should consult a qualified professional advisor. In addition, this publication may contain certain content generated by an artificial intelligence (AI) language model. You acknowledge that Sikich shall not be responsible for any loss sustained by you or any person who relies on this publication.