


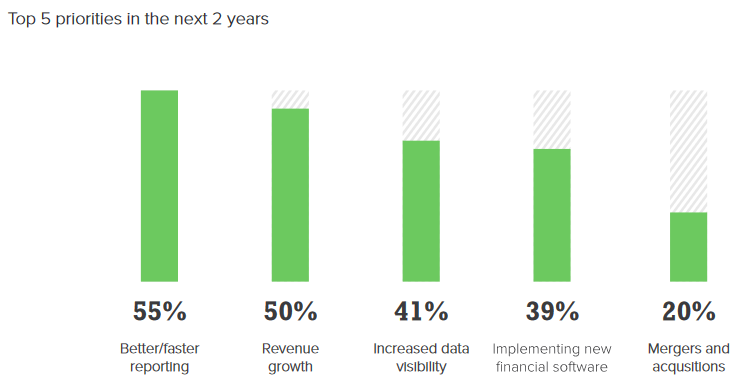
More than half (55%) of Chief Financial Officers in 2019 report better/faster reporting as a top priority in the next 2 years. Meanwhile, only 35% indicate they plan to leverage artificial intelligence (AI) and machine learning in the next 3 years. This is according to research published by NetSuite Brainyard in its first CFO Survey which polled 166 CFOs from 23 industries. It may come as no surprise, then, that NetSuite’s updates to its SuiteAnalytics feature set for the 2019.2 release center around improving the user experience and reducing time to value for its customers rather than advanced data interrogation techniques.
NetSuite’s Customer-First Approach
It’s not that NetSuite is against leveraging new technologies—quite the opposite, actually. NetSuite and Oracle continue to invest aggressively in AI and machine learning, especially in areas likely to be most impactful for customers.
For instance, NetSuite founder Evan Goldberg commented at SuiteWorld 2019 the substantial value that he expects customers will see from Netsuite’s planned migration to Oracle’s Autonomous Database, a cloud database that relies on machine learning rather than humans to maintain and improve the database’s architecture:
“We’ve already done tests that show it’s going to be amazing for a really complex application like NetSuite …
We have many thousands of customers. We can’t hire a database administrator for every one of them to tune it for their particular use of the application. [When we] deliver autonomous database, it’s going to be a DBA for each of our tens of thousands of customers, making sure the system is tuned for their particular use.”
The 2019.2 Release and SuiteAnalytics Updates
We are pleased to see NetSuite’s continued pursuit of customer betterment reflected in its 2019.2 release. When it comes to the SuiteAnalytics feature set, there are three specific developments that excite us:
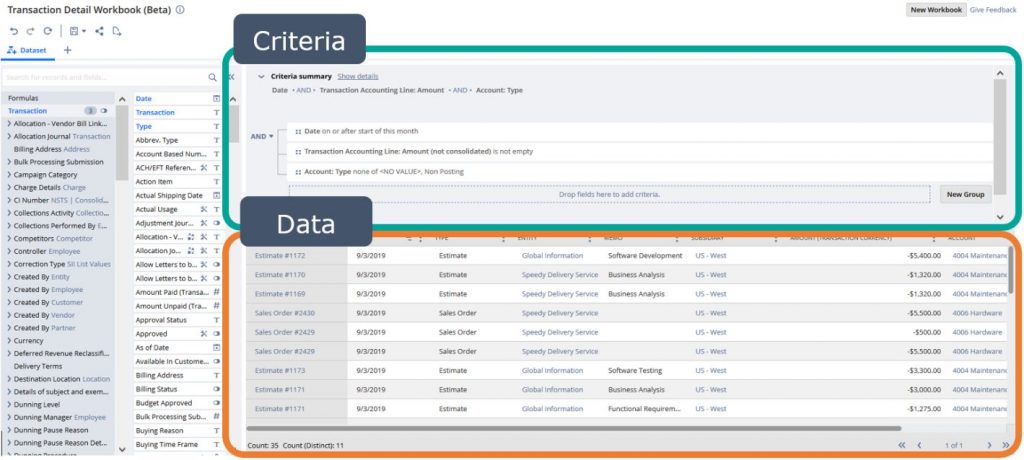
- The Data and Criteria tabs in the SuiteAnalytics Workbook have been merged into a single DataSet tab
- The Fields list in the Workbook has been split into the Records and Fields lists
- Workbook Pivots are now supported in the Analytics portlet for Dashboards
Criteria and Data Tabs are Merged
With the 2019.2 Release, users no longer will have to switch back and forth between the Criteria and Data tabs to filter data and see the output in SuiteAnalytics Workbooks.
Instead, the two tabs have been merged into a single one called DataSet. The drag-and-drop functionality for fields has been retained, and the Data grid adjusts dynamically as criteria are set.
DataSet Tab in a SuiteAnalytics Workbook
Records and Fields Lists Are Split
In another user experience improvement, the Fields list has been split into connected Records and Fields lists. When a record type is selected in the list on the left, its fields are shown on the right. This, in itself, is not that big of a change but it enabled 3 pieces of ancillary functionality that are quite useful:
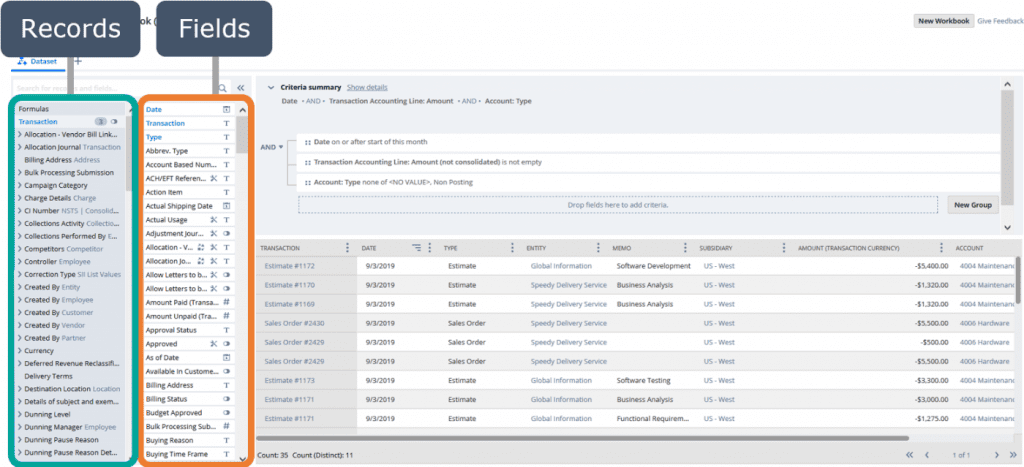
All Related Record Types Are Listed by Default
Every related record type is now listed by default in the Records list even if it is multiple joins apart from the Record upon which the Workbook is based (the root record). This will reduce the amount of time it takes for users to find the fields they want.
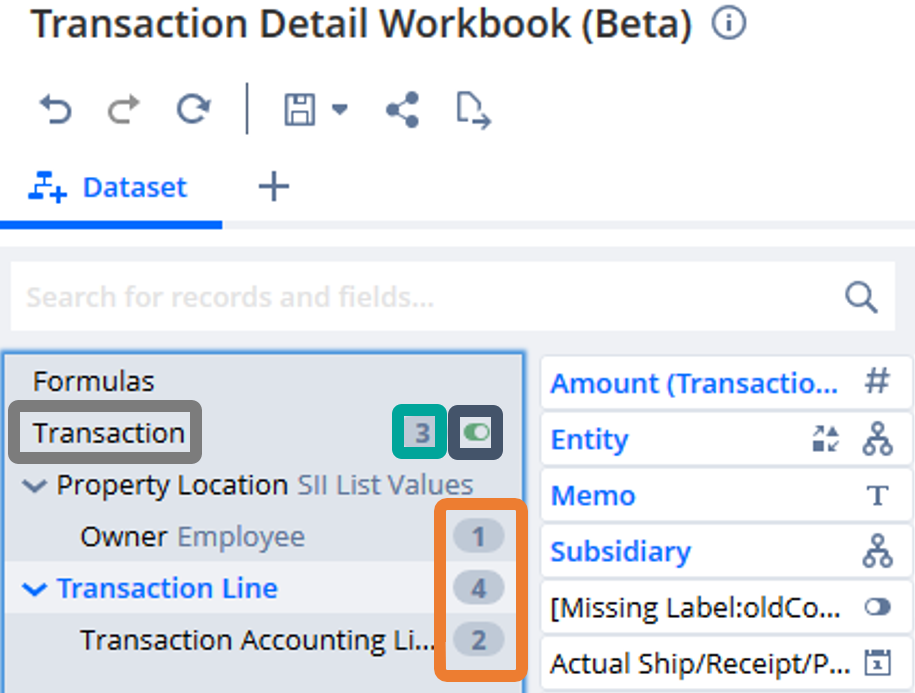
Fields and Record Types in Use Are Highlighted
Record types used in joins are now highlighted in the Records list and have a number next to them to indicate the number of fields in the Data from that record type. Additionally, fields used in the Data are also highlighted and appear at the top of the Fields list when their corresponding record type is selected.
Moreover, there is a toggle next to the root record to display only used record types in the Records list. This toggle can help a colleague quickly understand and inspect the source of the data in a Workbook.
 |
|
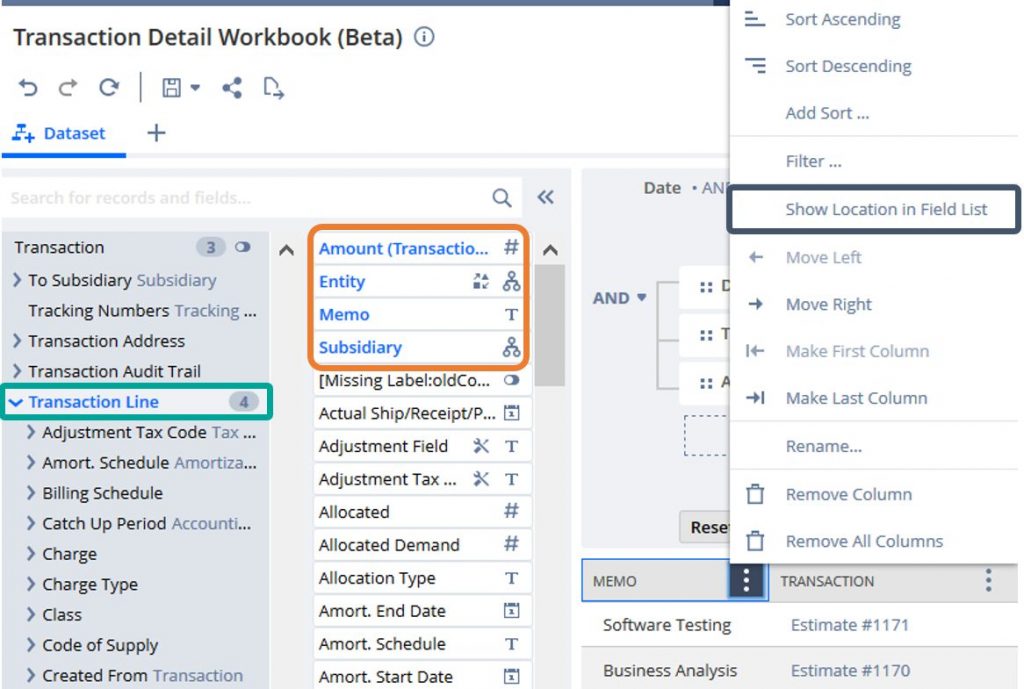
Fields in the Data Offer a “Show Location in Field List” Option
Being able to see which records/fields are in use in the Records and Fields lists certainly is nice but NetSuite takes it a step farther with the Show Location in Field List option. This is an option available on every field in the Data grid that helps locate the field in the Records and Fields lists.
When the option is selected, the field’s associated record type is selected and highlighted in the Records list. The fields for that record type are accordingly populated in the Fields list.
In the example below, the operation is performed for the Memo field. The field is located in the Transaction Line record type and the fields in use under that sort to the top in the Fields list.
Pivot Tables Available in Analytics Portlet
Prior to 19.2, only Charts from Workbooks could be viewed in the Analytics portlet on dashboards. Now, Pivots from Workbooks can be viewed as well. This is a welcome addition to further increase the visibility of an organization’s data and adds much appreciated presentation versality.
Wrap Up
NetSuite continues to drive hard to set the standard for embedded analytics and this new release reaffirms that commitment. The revamped tools under SuiteAnalytics Workbooks and Dashboards center around improving the user experience and resolving common pain points.
If you would like more information about NetSuite, please contact us at any time! You can also learn about more great tips for NetSuite on our YouTube playlist or our other blog posts.
This publication contains general information only and Sikich is not, by means of this publication, rendering accounting, business, financial, investment, legal, tax, or any other professional advice or services. This publication is not a substitute for such professional advice or services, nor should you use it as a basis for any decision, action or omission that may affect you or your business. Before making any decision, taking any action or omitting an action that may affect you or your business, you should consult a qualified professional advisor. In addition, this publication may contain certain content generated by an artificial intelligence (AI) language model. You acknowledge that Sikich shall not be responsible for any loss sustained by you or any person who relies on this publication.