This website uses cookies so that we can provide you with the best user experience possible. Cookie information is stored in your browser and performs functions such as recognising you when you return to our website and helping our team to understand which sections of the website you find most interesting and useful.
Salesforce Reporting for Insurance Organizations

Reporting can mean a lot of different things to different people, so let’s dive into the nitty-gritty of reporting using Salesforce.
First, let’s talk about reports vs. views vs. dashboards
Reports
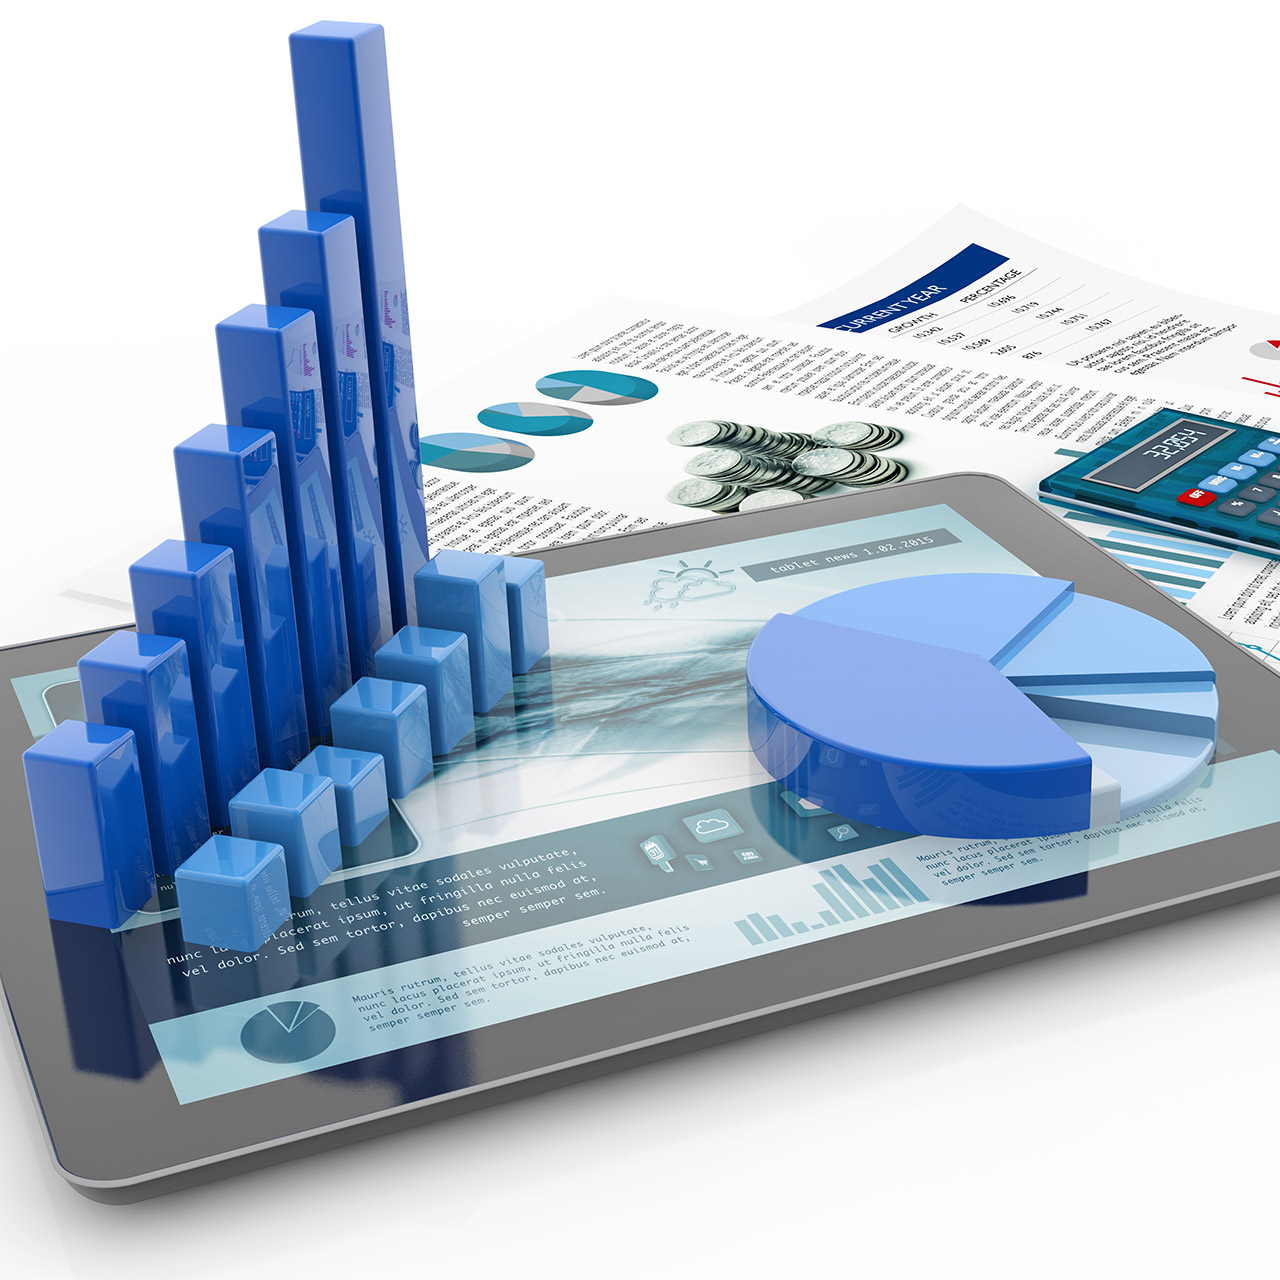
Reports are detailed data that can be grouped together to provide a visual representation for users. These illustrations can take many forms, including bar charts, pie charts, gauge charts, and more.
Views
While views are not technically reports, many people use the views tab as a way to get a snapshot of a particular data component.
Dashboards
Compilation of report components that can represent data from multiple objects. The graphs and illustrations from reports can be put into a dashboard so that users can analyze data from several different angels.
Viewing data using reports
The reports tab allows you to view a lot of data, which can be sorted by individual markers such as high to low or low to high. When users group data together, they can generate a visual representation or graph.
Viewing data using views Salesforce
Using the Opportunities tab on Salesforce, you can build specific criteria that once enacted allows you to view a subset of your data. For example, you can target “policy renewals in the next 30 days” vs. all policy renewals.
Viewing data using Dashboards
Dashboards allow users to view data lists as well as several charts and graphs at once. Clicking on any component on the dashboard view opens up the individual data report.
So, what are the takeaways about reporting?
When it comes to reporting, the solution needs to match the user’s needs in order to take action. Sometimes less is more.
Dashboards can be filtered based upon specific criteria, such as geographic location or product type.
Dashboards inherit and obey data visibility rules. So you can set up different views for different users, such as clients and agents and Salesforce will ensure they can only see the data they have permissions for.
Reports and dashboards can be emailed as often as you choose. So you can set up reports to go out daily or weekly, allowing viewers to be alerted to data changes and take action as needed.
How Can I Get Started With Financial Services Cloud?
To learn more about how Salesforce Financial Services Cloud can help your company optimize their reports using Salesforce Financial Services Cloud contact Sikich to connect with our team of highly skilled Financial Service Cloud experts today.
This publication contains general information only and Sikich is not, by means of this publication, rendering accounting, business, financial, investment, legal, tax, or any other professional advice or services. This publication is not a substitute for such professional advice or services, nor should you use it as a basis for any decision, action or omission that may affect you or your business. Before making any decision, taking any action or omitting an action that may affect you or your business, you should consult a qualified professional advisor. In addition, this publication may contain certain content generated by an artificial intelligence (AI) language model. You acknowledge that Sikich shall not be responsible for any loss sustained by you or any person who relies on this publication.


