


Gantt charts for Production orders have existed since the earliest versions of the system. Recently in D365 for Finance and Operations significant improvements have been made to the graphics and a new feature for material shortage has been added.
This blog will show Gantt chart tips for production schedulers and supervisors in discrete manufacturing.
The Gantt chart only works after running Job scheduling first.
The Gantt chart can be found on the Scheduling tab in the action area. It also exists as a separate menu choice in Production Control.
There are two choices. The “Gantt chart” shows all job scheduled production orders in its Resource view. The “Gantt chart – fast view” only displays the production order you are on. That is not the only difference. Graphical (re)scheduling is not possible in the “fast view,” only in the “Gantt chart.”
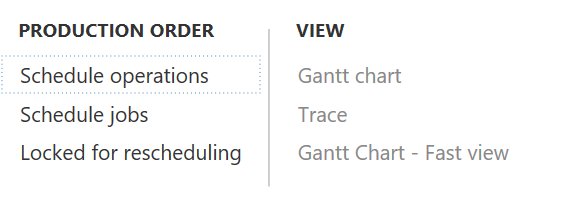
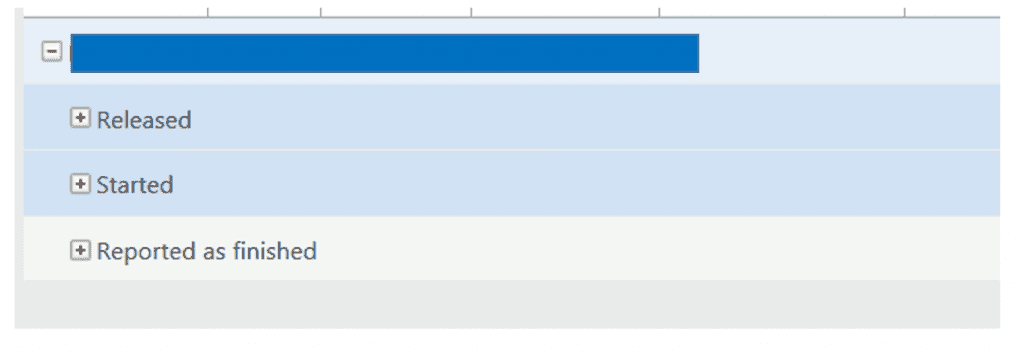
When the Gantt chart choices in the screen above are not lit up it is because we have not run “Schedule jobs.”
Graphically Scheduling Production Orders
One of the functional purposes of the GANTT chart is to schedule production orders graphically by dragging and dropping. Graphical (re)scheduling is done in the first choice “Gantt chart.”
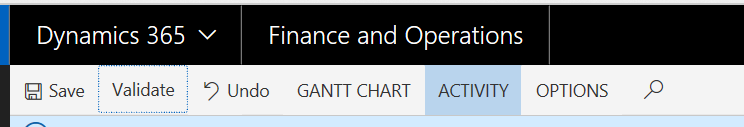
The “Validate” button is very important. After making a change in the production schedule by drag/drop, always hit validate.
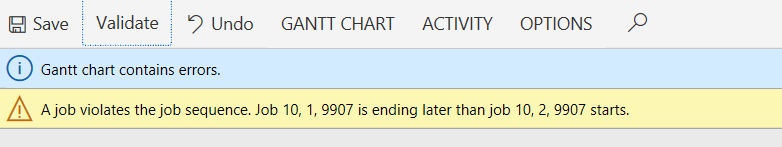
This error will happen when your graphical scheduling creates a conflict. The “Undo” will help!
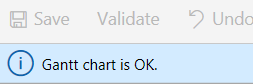
When saving, the production order scheduled dates will be updated.
View Mode
The GANTT chart has an Order view and a Resource view.
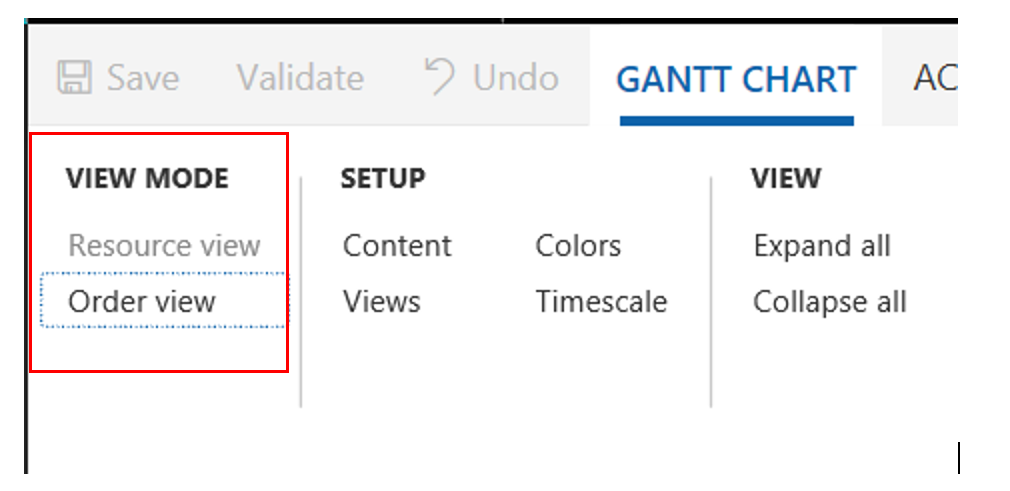
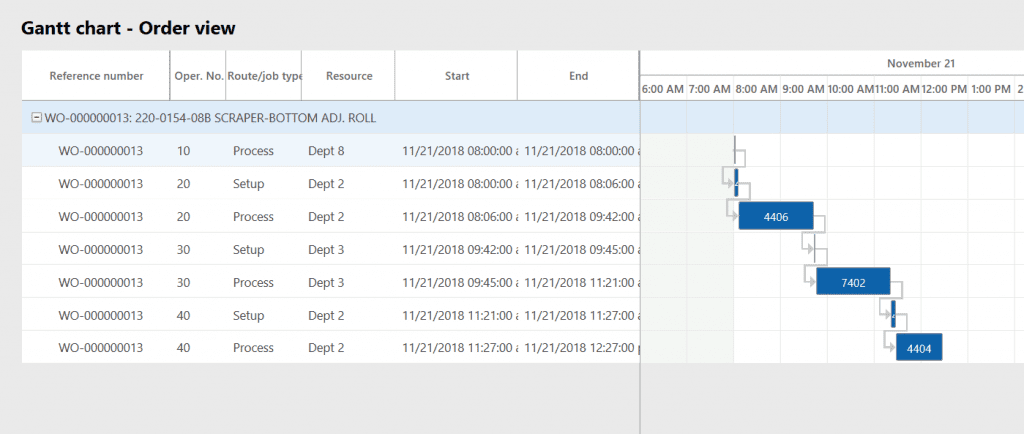
In the Order view, we see the Production order going through the routing steps on Resource Groups.
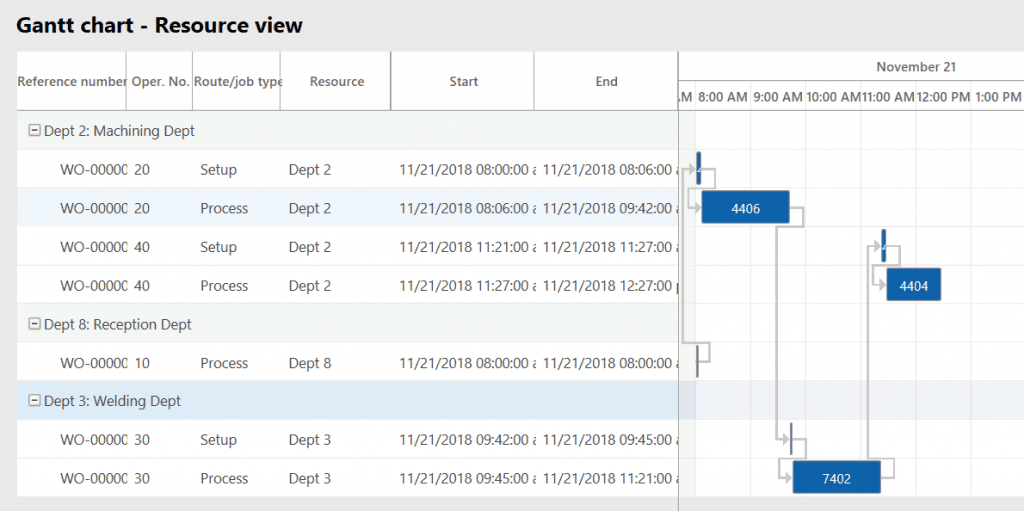
In the Resource view, we see the Resource Group first, then the production orders scheduled on it.
Now we will explore the SET UP options.
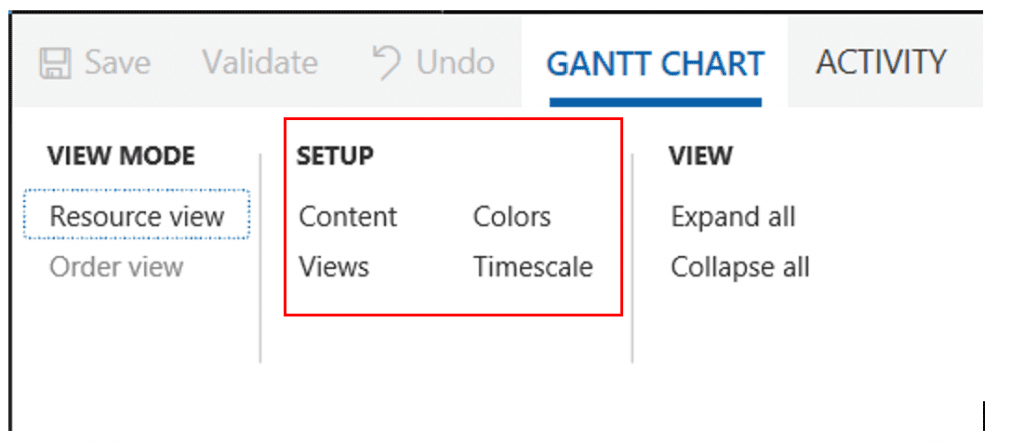
Content
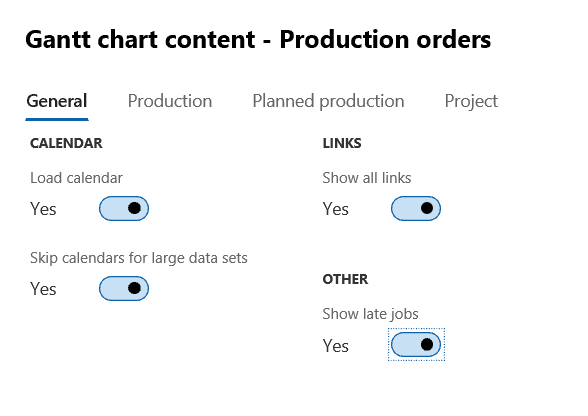
Load calendar: Always yes. If no calendar loaded, weekends and holidays etc. will not show.
Skip calendars for large data sets: Yes. If you say no, the system will do it anyway when it encounters a “large data set.”
![]()
This message explains what the system means with “large data sets.” If I display the time scale in hours, and I have a range of a year or more, I have a “large data set.”
Show all links: Always yes (the links between operations will be shown)
Show late jobs: One would typically choose “Yes.”
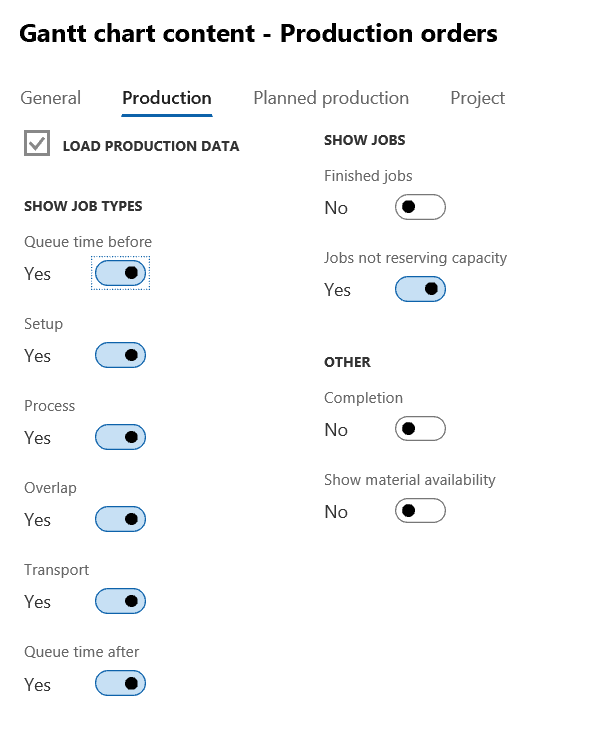
Show Job Types
This list is the display yes/no for routing time segments we want to see in the Gantt chart.
Show Jobs
Finished jobs: Finished routing jobs can be shown or not.
Jobs not reserving capacity are typically “queue time” jobs but this is only relevant when using job management is checked for queue times. The Route group checkboxes determine whether a routing time segment is “reserving capacity” or not, see below:
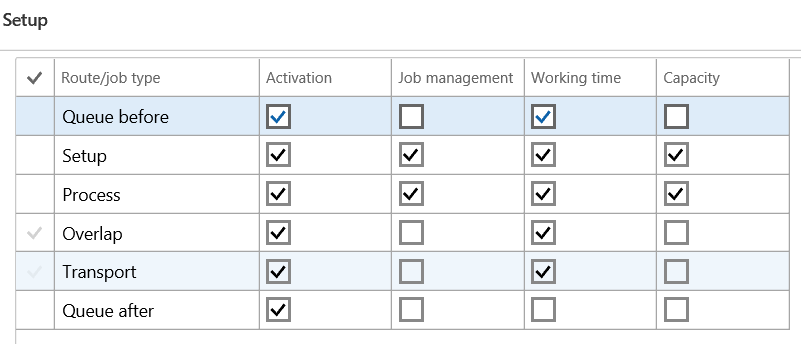
This is the route group. Every routing operation needs to have a route group. The last column “capacity” determines whether the time in a job type is reserving capacity. Anything else then the setting shown here is very unusual. Queue times by definition do not reserve capacity nor do any of the others.
OTHER
Completion – this slider is a surprise: it controls the hovering information for a production job. It will display the complete% of the routing card line when set to “Yes.” If you say “No,” you will see this:

But if you say “Yes,” the processing percentage is added to the “hover.”

Another example:

NOTE: This calculated processing percentage shows only when you use the Job card for time reporting. The “100%” will show when the operation is reported complete and then it does not matter whether you used a route card or a job card journal.
Show material availability is the most interesting feature. For a production order, it will find the longest lead time item in the Prod-BOM and display the date of its (planned) receipt in the Gantt chart!
When there is no supply order or a planned order for an item in the Prod-BOM, the system will display a question mark as shown below. The system can not know when the material would be available.
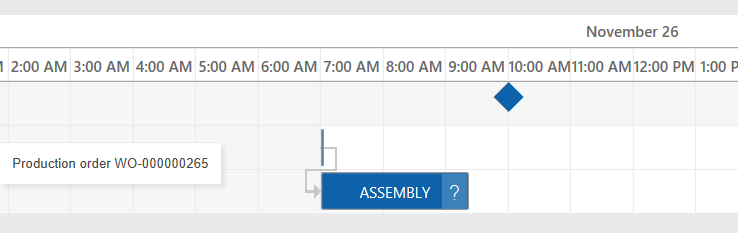
The question mark shown above means: at least one of the items needed for Assembly operation is not available and there is no supply planned or scheduled for it. Apparently MRP has not been run yet.
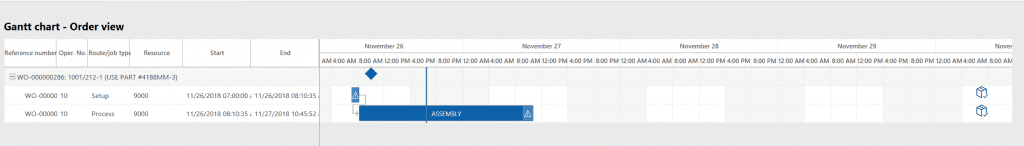
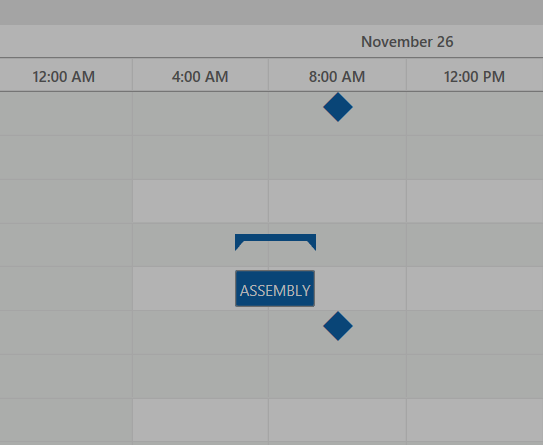
A triangle in the operation means that at least one material in the Prod-BOM is not available. The date of the latest arriving material is indicated with a box icon.
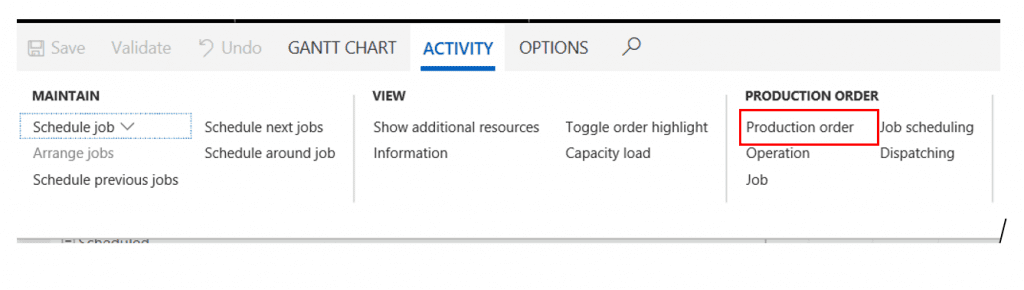
The material shortage alert makes no distinction between a planned order or a scheduled supply order (which can be a Purchase order, a Production order or a Transfer order). The material availability feature in the Gantt chart can of course only send a general signal. To know which part numbers are not available, the user would go back to the production order via the choice in ACTIVITY below. Once in the production order, one an see the short part numbers via View/Explosion.
Views
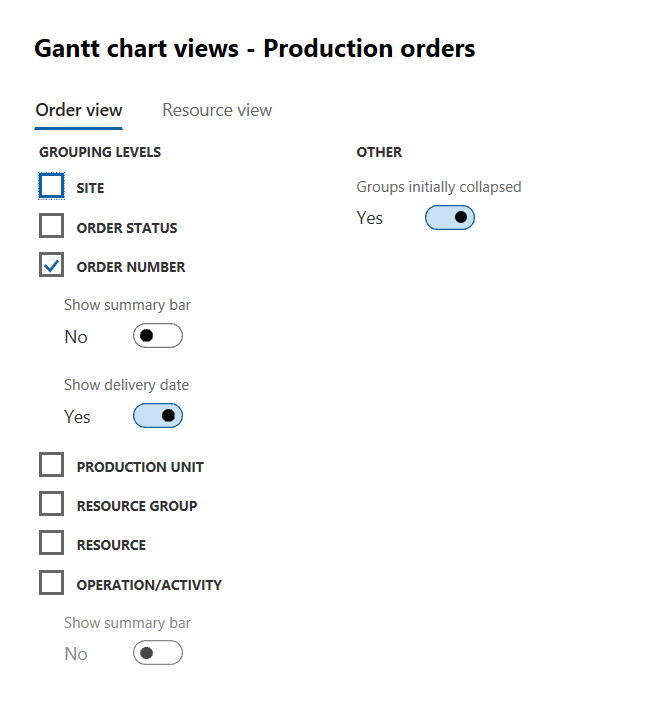
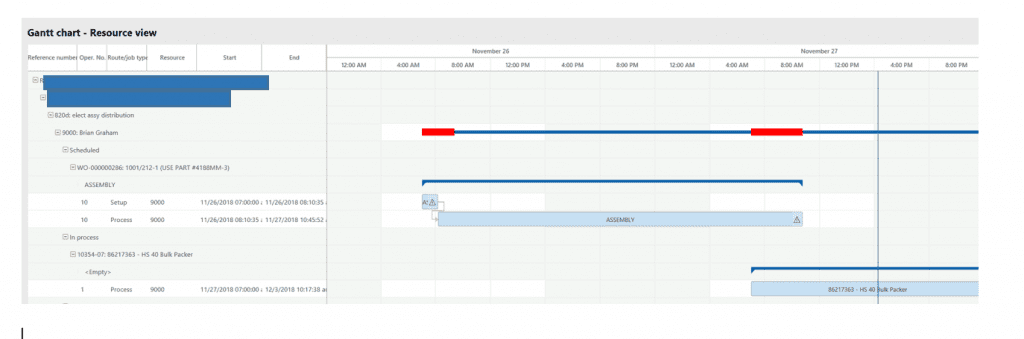
If we check all options shown above, including the summary bars, we get a picture like this:
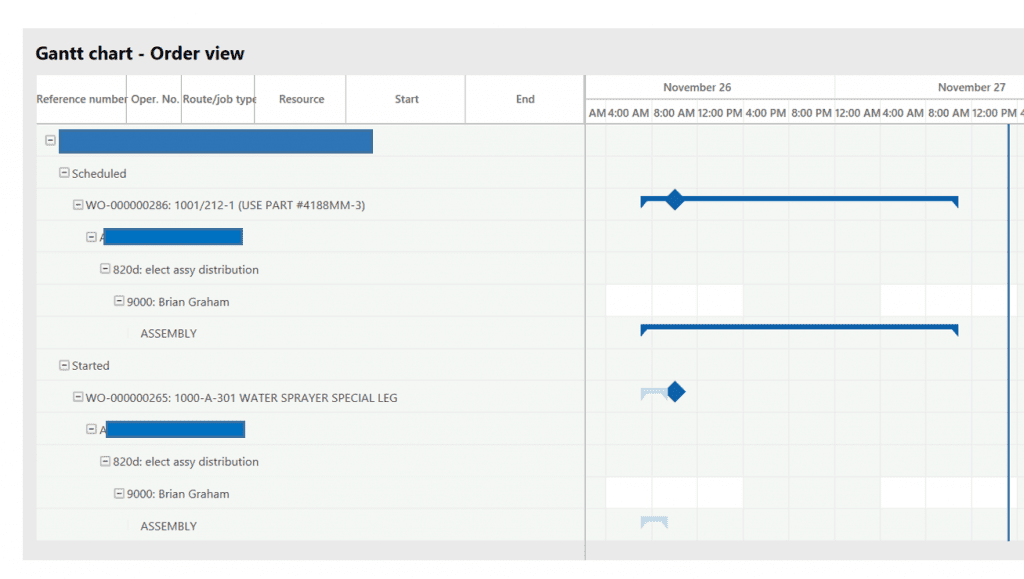
When all grouping levels are checked, the system shows tree structures in the exact sequence as in the VIEW parameters: SITE, Status, Production order, Production unit, Resource group, Resource, Operation. This means that within a site, you get different trees per order status.
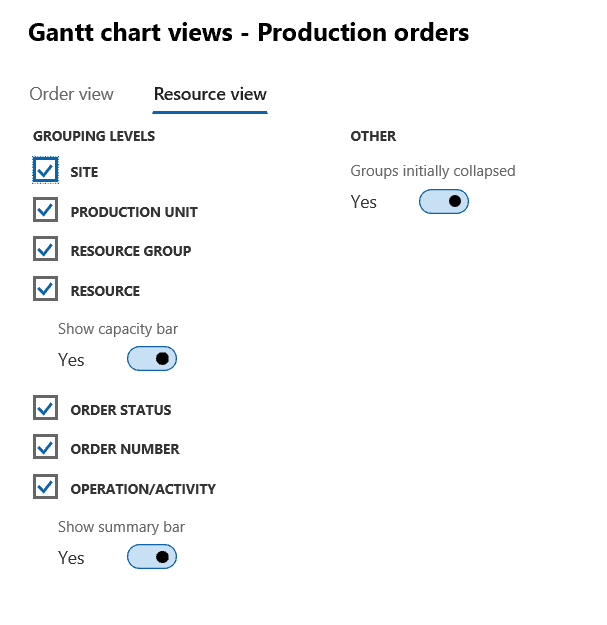
The resource view has he same parameters as the order view with one exception. The “capacity bar” option for a resource which looks like this:
NOTE: Remember that job scheduling always schedules the jobs on a resource. If the routing operation is planned on a resource group and we do not run finite capacity, it will always take the first resource in the group.
The red simply color indicates non -working hours.
“Show delivery date” will display the delivery date of the production order as shown below.
Timescale
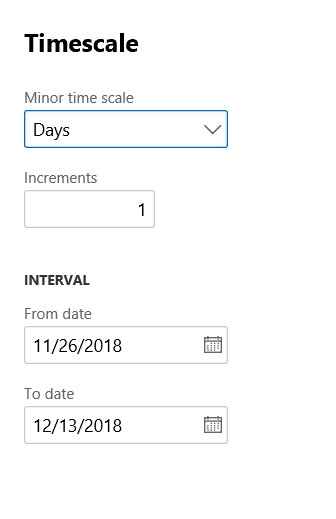
A special feature for the timescale is the “Increments” option where you can show four hours at a time or two days at a time. See below for an example for an increment of three days.
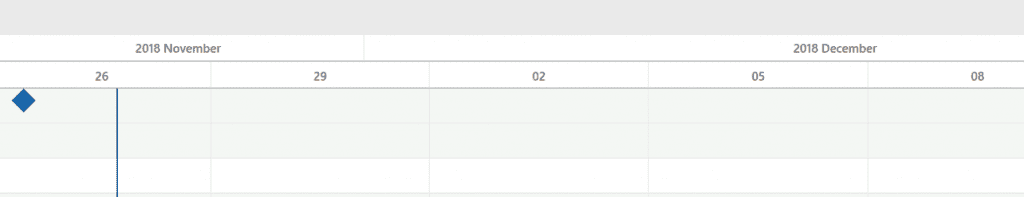
Timescale shown with increments of 3 days.
Conclusion
The Gantt chart for production orders is a useful graphical display of production order schedules with many viewing options, but we wish the chart was available for operation scheduling, because many D365 manufacturing companies run operation scheduling. The material shortage indicator is a useful feature. Instead of the timescale feature we would rather have a zoom in / zoom out which is the norm on all graphical displays of any application nowadays.
This publication contains general information only and Sikich is not, by means of this publication, rendering accounting, business, financial, investment, legal, tax, or any other professional advice or services. This publication is not a substitute for such professional advice or services, nor should you use it as a basis for any decision, action or omission that may affect you or your business. Before making any decision, taking any action or omitting an action that may affect you or your business, you should consult a qualified professional advisor. In addition, this publication may contain certain content generated by an artificial intelligence (AI) language model. You acknowledge that Sikich shall not be responsible for any loss sustained by you or any person who relies on this publication.