


Netsuite 2019.2 update includes updates for both the Dashboard and SuiteAnalytics, but more importantly, it includes new SuiteAnalytics features. Here are all of the new features and what they entail.
New Dataset Tab and Enhanced Fields List in SuiteAnalytics Workbook
In order to eliminate having to switch between tabs to author workbooks, the Data and Criteria will be merged into the Dataset tab. You will have the ability to apply criteria filters to the workbook source data without having to switch tabs. The Fields list on the Dataset tab has also been redesigned as the Records and Fields lists. The Records and Fields lists include the following enhancements so that you can quickly locate, identify, and join related record types and fields in a workbook:
- All related record types are automatically listed in the records list, including record types that are multiple joins.
- Record types that have been joined in a workbook are highlighted in the Records list with a number denoting the number of fields used within the workbook.
- Fields that have been added to the Data Grid are highlighted and appear at the top of the Fields list.
- From the Field menu in the Data Grid you can access the Show Location in Field List. This can be used if you do not know which record type a field on the Data Grid belongs to.
Additional Filter and Sort Options for Workbook Pivot Tables and Charts
You can apply filters to view the top and bottom results based on a specific measure on workbook pivot tables. Your sorting options are based on dimensions and measure-based values, enabling more customization on your pivot tables and charts.
Categories included on Record Type Selection Page in SuiteAnalytics Workbooks
As you create a new workbook, you are prompted to select a root record type for the workbook. This current feature gives no way to distinguish between standard, custom, and analytical record types. By including Categories and the unique record ID for each record type on the record type selection page, users can select the correct record type (standard, custom or analytical) for the custom workbook to create.
Updated Data Refresh Tool
Prior to the 2019.2 release pivot tables and charts may have displayed cashed data rather than the most current data. Now NetSuite has made it a default to clear the cache every 60 minutes for pivot tables and chart data to provide better performance. It also provides a caching process so that you can clear any cached data and verify that pivot tables and charts display the most current data. In order to clear the cache, click the menu icon next to the Last Updated date displayed in the upper-right corner of the viewer. A popup message appears asking if you want to clear the cache.
As of 2019.2, the following Portlet enhancements include the supporting of Workbook Pivot Tables Prior to 2019.2 you could only view chart-based workbook data on the Analytics Portlet. With the new enhancement your pivot-table workbook data can now be viewed on the home dashboard. NetSuite has also increased the number of Analytic Portlets on your dashboard from 5 to 10.
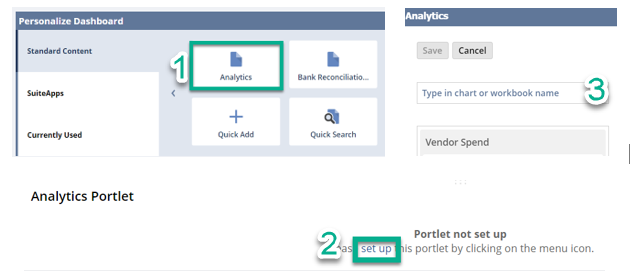 Once you have added the Analytics Portlet to your dashboard, you will want to select which chart or pivot table to view. By clicking setup, the Analytics popup window will display the workbooks with either a chart or pivot table defined already within your account. You can select from a drop-down list to quickly identify charts or pivot tables or use the search field to enter the name of the workbook, chart or pivot table that you want to view.
The number of Analytic Portlets that you can add to your dashboard has increased from 5 to 10. This enhancement will give you dashboard visibility into workbook data for double the pivot tables and charts. NetSuite has also increased the number of KPI headlines available within the KPI portlet. In previous versions you could only view 4 KPI’s as headlines in the Portlet at any point in time, The KPI portlet will now support up to eight KPI’s displayed as headlines.
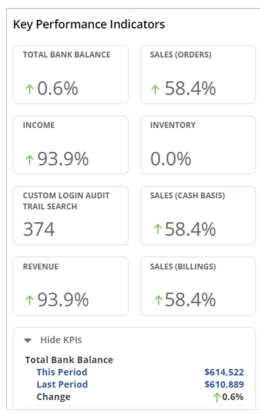
Additional KPI enhancements are added in order to fully utilize the Narrow Dashboard column. Prior to 2019.2 the KPI portlets in the narrow column view only displayed as headlines without any expand/collapse settings available. As of 2019.2, you can now collapse and expand the list of KPIs as needed. Trend graphs will not display as headlines due to the narrow column format; you do have the option by default to view a popup trend graph by clicking on the trend graph icon.
The last two KPI enhancements are the KPI Meter Portlet Currency symbol (left) and Trend Graph Portlet Title (right). The KPI meter displays the currency symbol of the data for values represented by currencies. In 2019.2 the portlet displayed the name of the first KPI and the time period selected. Now you can enter a title for your portlet to quickly identify it.
Full Screen View
With the new Full Screen View you can expand portlets to full screen by clicking the double arrow icon in the upper right corner of any portlet. This capability enables you to see data at a glance for the following portlets, Trend Graphs, Report Snapshots, Tasks and Phone Calls.
SuiteAnalytics Workbook Demo:

- To access the SuiteAnalytics tool and workbook page Navigate to the Analytics tab.
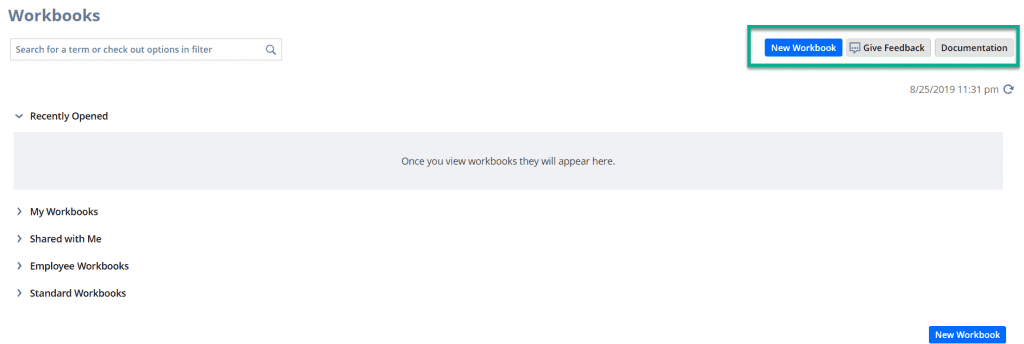
- From here you can create a new workbook
- Access the SuiteAnalytics help documentation and provide feedback.
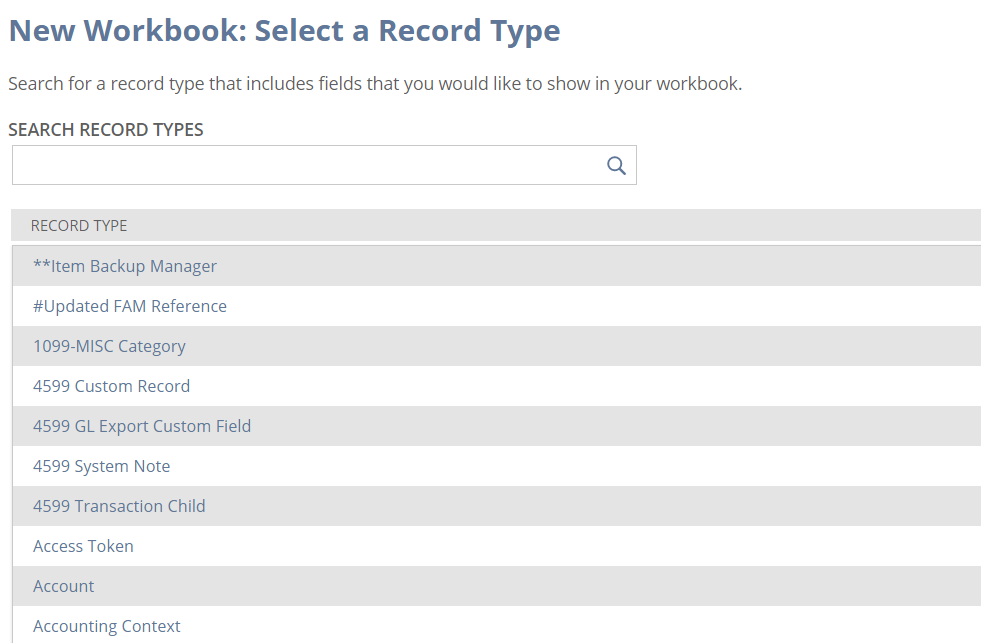
- Click new Workbook to create a new workbook. Listed are all record types based on your NetSuite permissions and enabled features.
- Choose a record type to start your workbook.
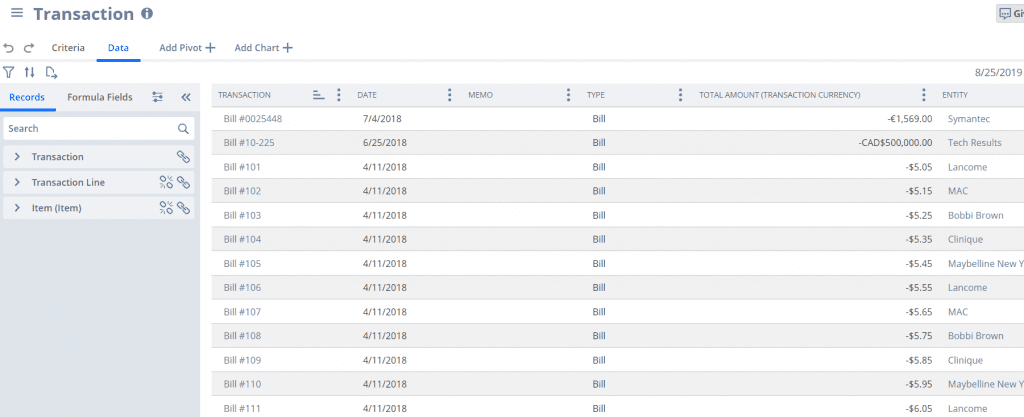
- Once you have chosen your record type, the SuiteAnalytics Workbook data tab appears.
- To improve performance, custom transaction types are no longer available for use as the root record type in custom workbooks. Effective immediately, any workbooks in your account based on custom transaction types are no longer available.
- To query data from custom transaction types in SuiteAnalytics Workbook, create a new workbook using the generic Transaction record type and add criteria filters using the Type field.
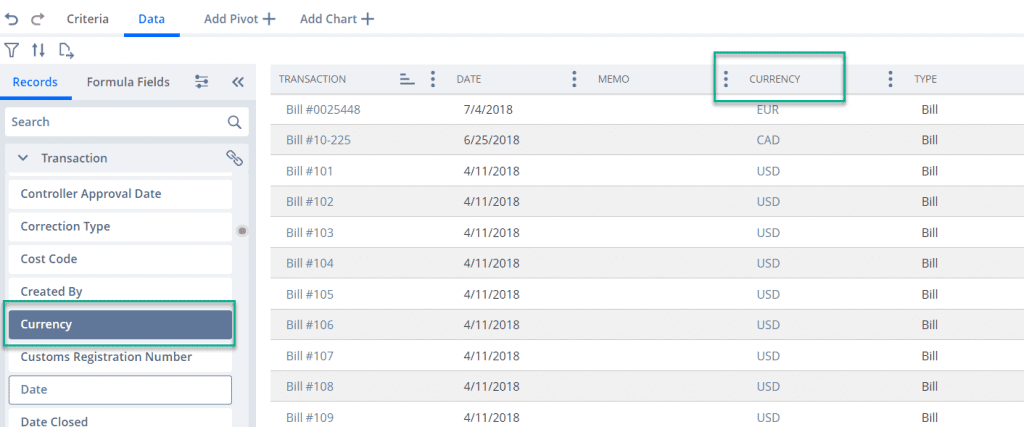
- To define the workbook source data, add fields from the fields list on the left to the data grid on the right.
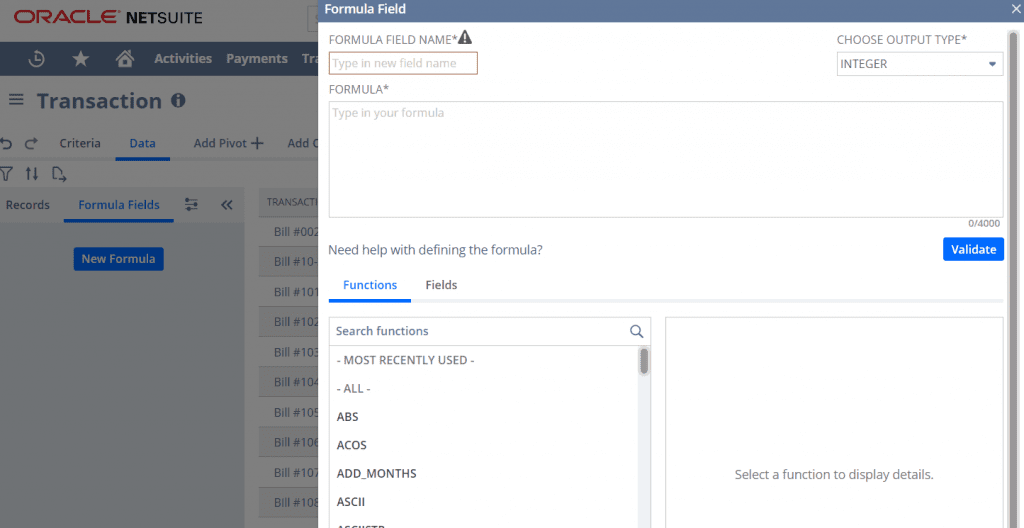
- You can add custom formulas to your workbook source data.
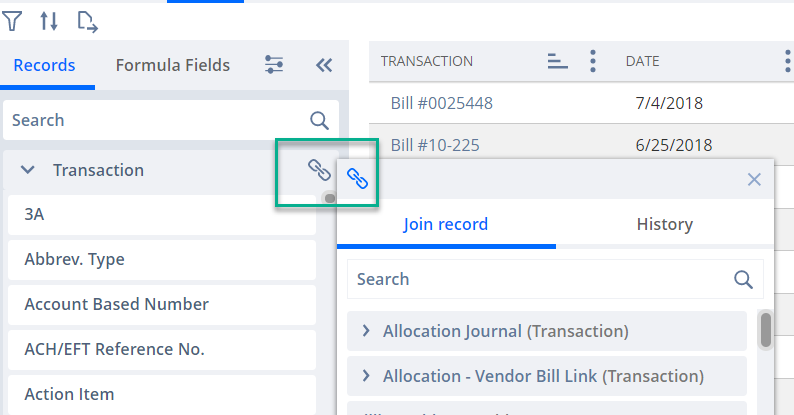
- Click the join record icon to join a related record type to your workbook.
- All related record types are automatically listed in the Records list, including record types that are multiple joins apart.
- Record types that have been joined in a workbook are highlighted in the Records list with a number denoting the number of fields used within the workbook.
- Fields that have been added to the Data Grid are highlighted and appear at the top of the Fields list.
- If you do not know which record type a field on the Data Grid belongs to, the new Show Location in Field List option enables you to locate the field in the Records and Fields lists. You can access the Show Location in Field List option from the Field menu in the Data Grid.
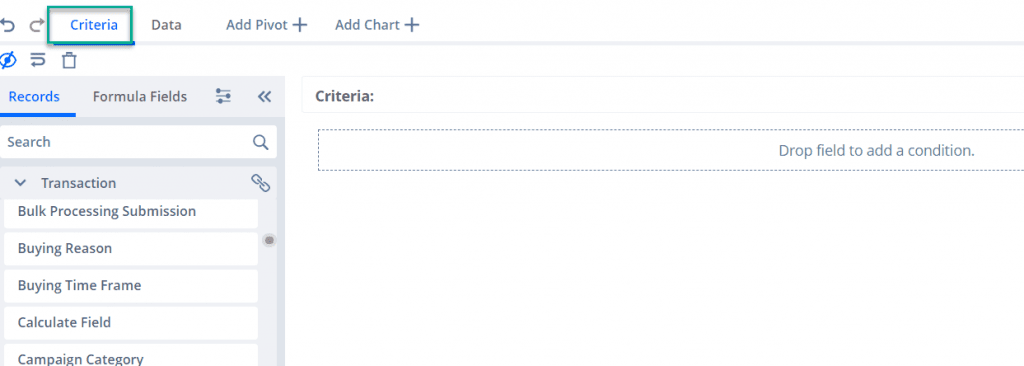
- Once you have completed all required fields you can refine the source data by using filter conditions under the criteria tab shown above.
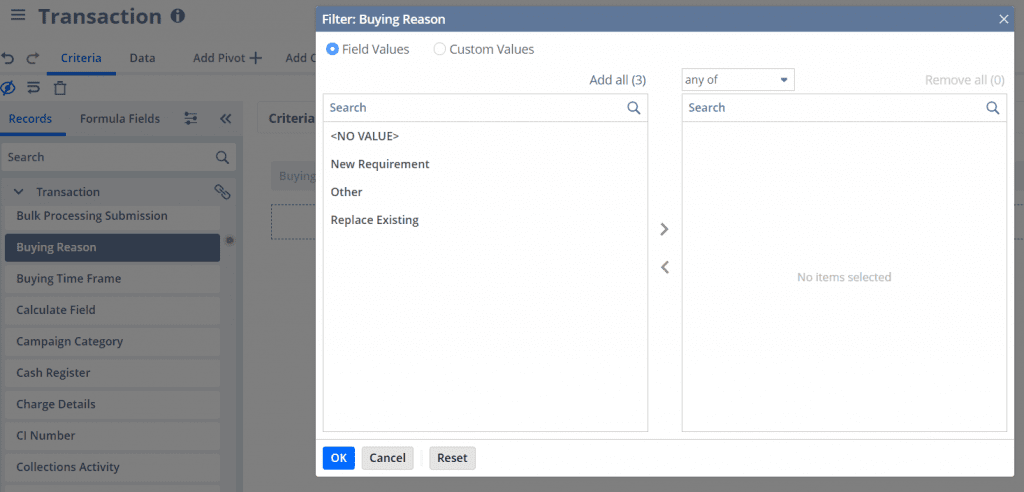
- Drag filter conditions from the fields list to the builder where you will set the specific filter conditions for each field. All filters can be created from either record fields or custom formulas that you have created.
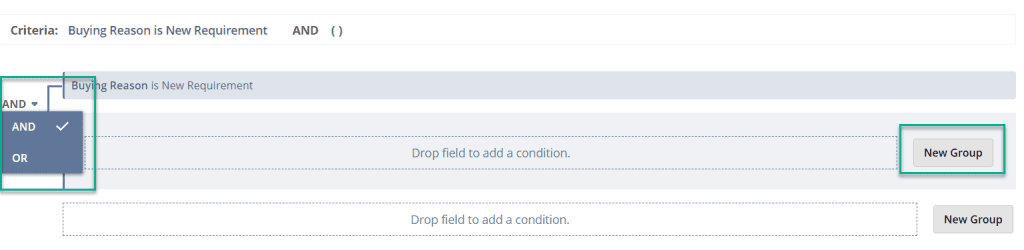
- You can create groups of filters with the ability to change the logic used to connect each filter.
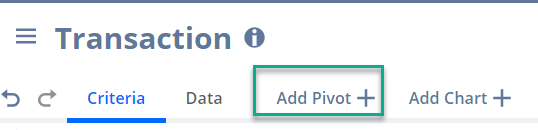
- Click the Add Pivot tab to generate a pivot table.
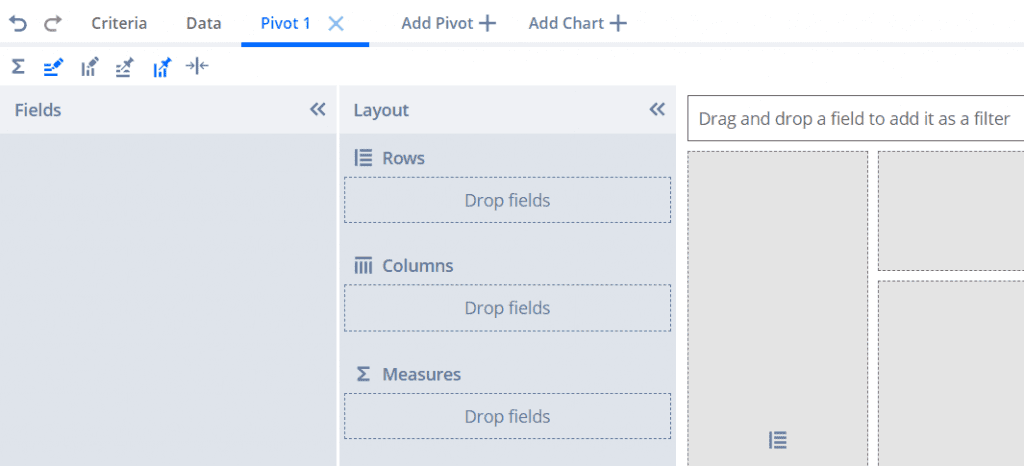
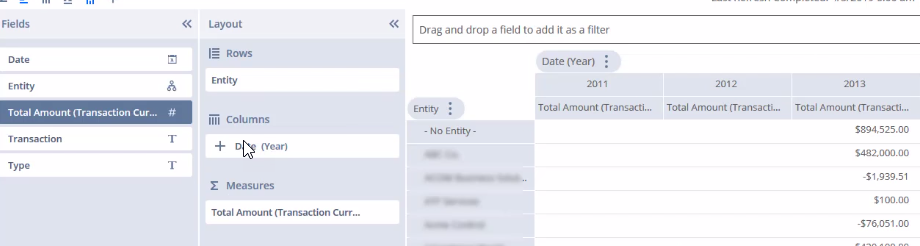
- From here you can drag fields from the fields list to the layout panel.
- You can add totals.
- Format the values shown in the table.
- Adjust the size of the table columns and rows.
- Use the table filter field above the table to filter/change values displayed in your table.
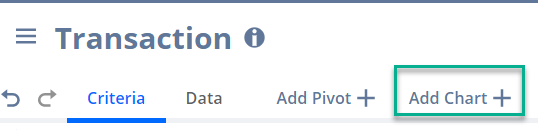
- Click the Add Chart tab to generate a chart.
- All steps and features to create a pivot table are the same for creating a chart.
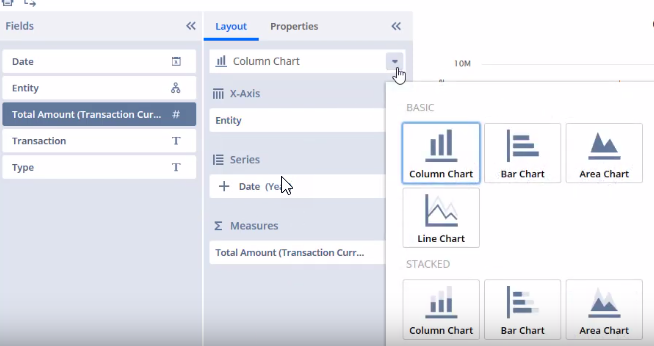
- There are multiple chart types and formats you can use to add labels and titles to your chart.
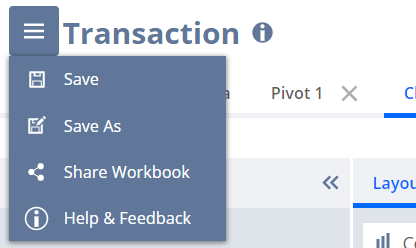
- To save or share your workbook at any point click on the menu icon select save or share workbook in the drop-down.
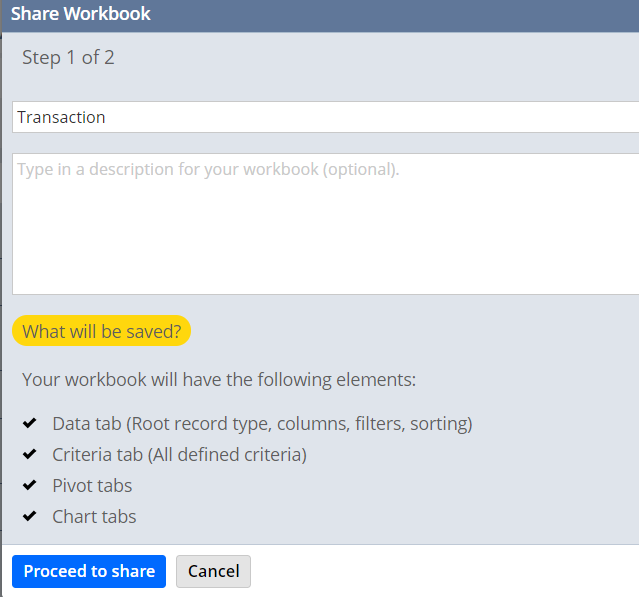
- Sharing your workbook includes any selections made on the Data tab, Criteria tab, Pivot tabs and Chart tabs. This enables any users to resume the work where you left off.
If you would like more information about NetSuite, please contact us at any time! You can also learn about more great tips for NetSuite on our YouTube playlist or our other blog posts.
This publication contains general information only and Sikich is not, by means of this publication, rendering accounting, business, financial, investment, legal, tax, or any other professional advice or services. This publication is not a substitute for such professional advice or services, nor should you use it as a basis for any decision, action or omission that may affect you or your business. Before making any decision, taking any action or omitting an action that may affect you or your business, you should consult a qualified professional advisor. In addition, this publication may contain certain content generated by an artificial intelligence (AI) language model. You acknowledge that Sikich shall not be responsible for any loss sustained by you or any person who relies on this publication.