


While markets are complex and forward-looking, transactions are processed in real time. When emotions are high, it can overwhelm the market. The market doesn’t like uncertainty, and the midterm elections create much uncertainty in this area.
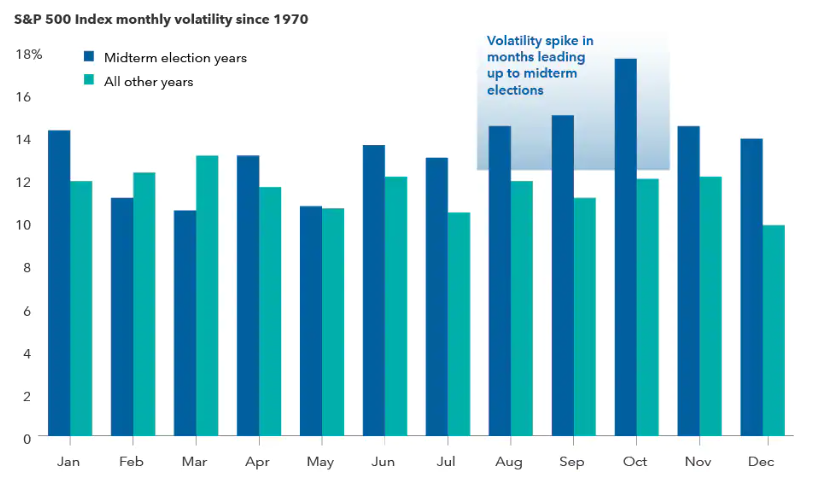
Years with midterm elections often bring volatility into the market, where we see more extreme spikes in returns – both highs and lows. This year, we’ve seen more downward spikes, but with the midterm elections occurring next week, what can we expect?
Capital Group analyzed and compared each month’s returns with midterm and non-midterm years all the way back to 1970. It found that midterm years had 10 to 12 months with higher volatility ramping up in the months before the election.
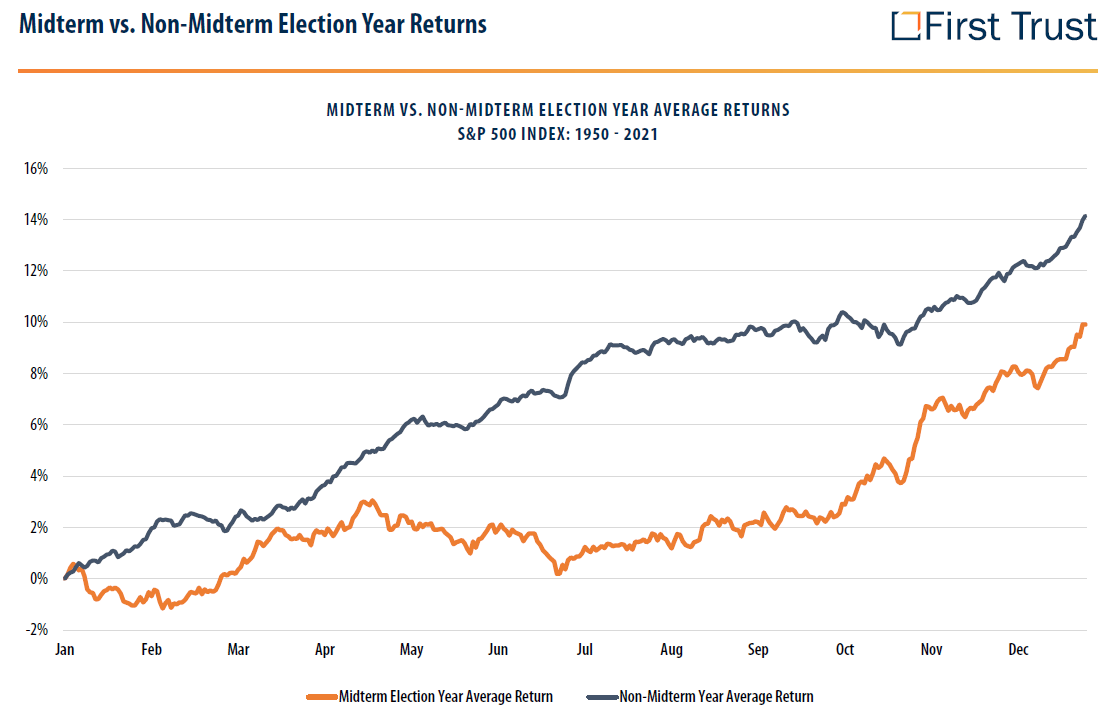
Studying trends since 1950, midterm election years have seen lower overall returns during the first three quarters of the year with an increase in returns during the fourth quarter. A research team at First Trust compiled the below chart of returns. The orange line is a historical average of midterm election year returns.
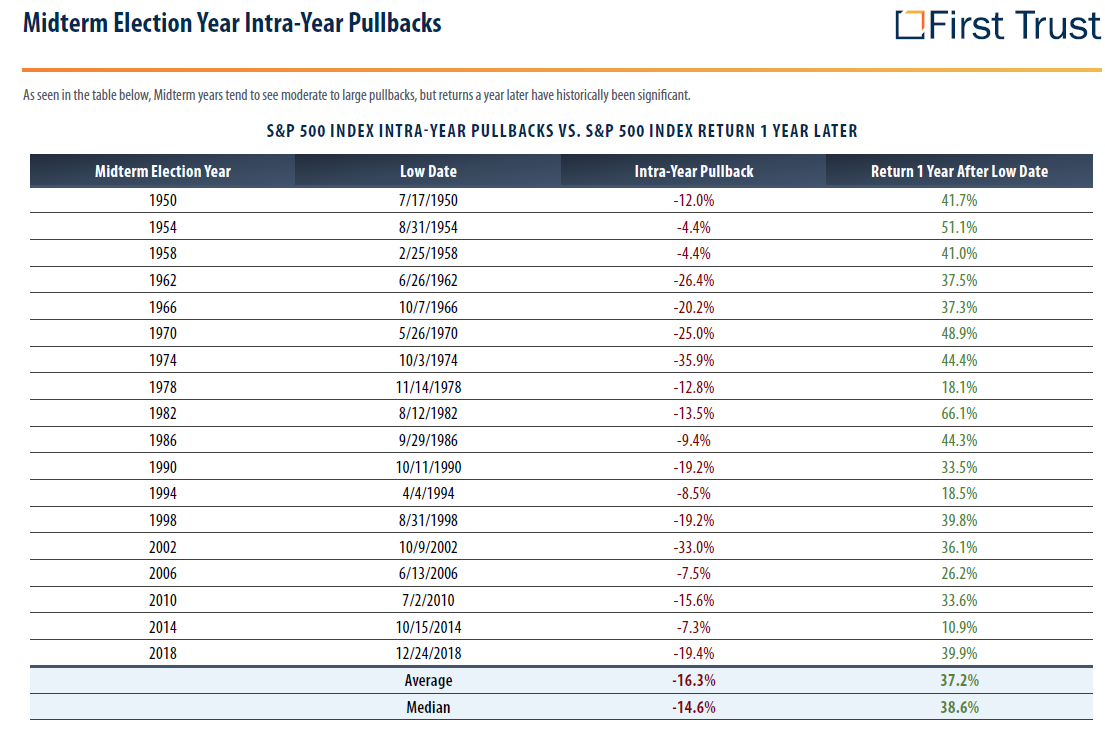
This chart shows that year-to-date has been a challenge in the market with reaching bear market levels during the third quarter. Bear market demonstrates a 20% drop from the highest points (which, in this case, occurred in January). The S&P500 recorded a drawdown of 27% at its low point in 2022. The research team at First Trust compiled the following list of midterm election year pullbacks in the S&P500. Each midterm year had some level of pullback during the year. Notably, each year after showed positive returns.
With the recent volatility and lows in the market, it may be tempting to sell everything and go to cash. However, that might be an emotional reaction. It’s difficult to time the market, but waiting to reinvest could potentially show higher prices than they are currently. When reviewing midterm election years past, we see that returns are historically lower the first three quarters of the year compared to returns in non-election years. We also see evidence that markets do come back over time, beginning in the fourth quarter. We can’t determine if that will play out this year, but historical trends can provide some optimism. It’s important to keep in mind, too, that midterm elections are one component of the many elements that can influence markets.
If you’d like to discuss your investment or financial portfolio with a specialist, please contact our wealth management team.
This material is based upon publicly available information and is provided for general information and educational purposes only. The information contained herein has been compiled from data considered to be reliable. The information in these materials may change at any time and without notice.
The S&P 500 Index is a market capitalization-weighted index based on the results of approximately 500 widely held common stocks. The market index is unmanaged and, therefore, has no expenses. Investors cannot invest directly in an index.
This publication contains general information only and Sikich is not, by means of this publication, rendering accounting, business, financial, investment, legal, tax, or any other professional advice or services. This publication is not a substitute for such professional advice or services, nor should you use it as a basis for any decision, action or omission that may affect you or your business. Before making any decision, taking any action or omitting an action that may affect you or your business, you should consult a qualified professional advisor. In addition, this publication may contain certain content generated by an artificial intelligence (AI) language model. You acknowledge that Sikich shall not be responsible for any loss sustained by you or any person who relies on this publication.