


Gantt charts are used in project planning almost by default. Microsoft project has the Gantt chart as the standard user working screen. Gantt charts offer instant visibility of a project by showing the relationships and timelines of activities. It is hard to imagine project plans without a Gantt chart.
For the history of the Gantt chart visit www.ganttchart.com.
For Production orders, the Gantt chart is less critical, but the graphical scheduling it offers is welcome. Its “Resource view” is also very useful as it provides graphical information about the workload on a Resource group or Resource.
The Gantt chart for production in Dynamics 365 for Finance and Operations has a refined set of options for color display that requires some special attention. It took me a while to figure it out, and I had to ask the original designers for certain details.
This blog will provide the colorful details, so the user can decide how to use “meaningful colors” in the Gantt chart.
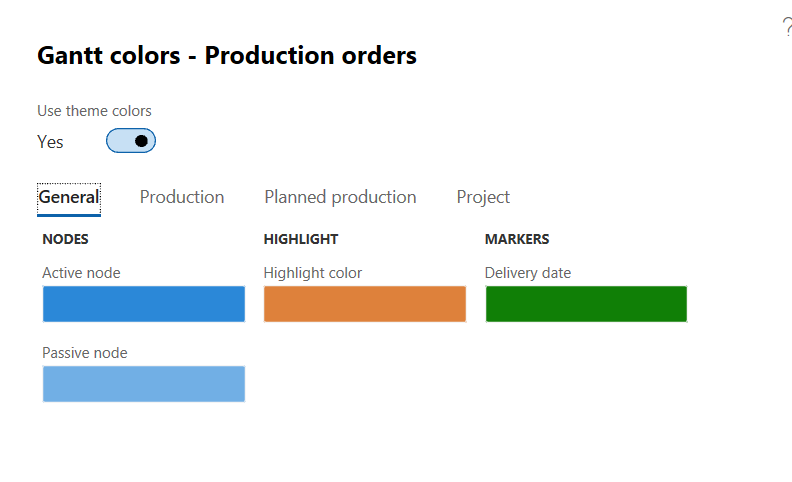
Use theme colors: Theme colors are your colors defined in your user options. If you say “Yes,” none of the options in the color parameters will work.
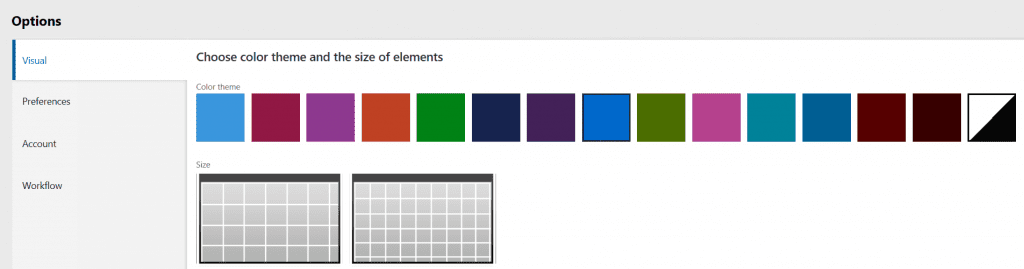
One of the colors chosen in your User options would be your theme color.
We don’t like that. We want to use more diverse colors, and we are saying “No” to this option. You don’t want theme colors, because you would only use your one color for everything.
Active node: Only relevant when you use the normal Gantt (not the fast view) chart which will display multiple production orders, at least the ones that have been job scheduled. The production order you are currently on is considered the “active node,” the others are “passive nodes.”
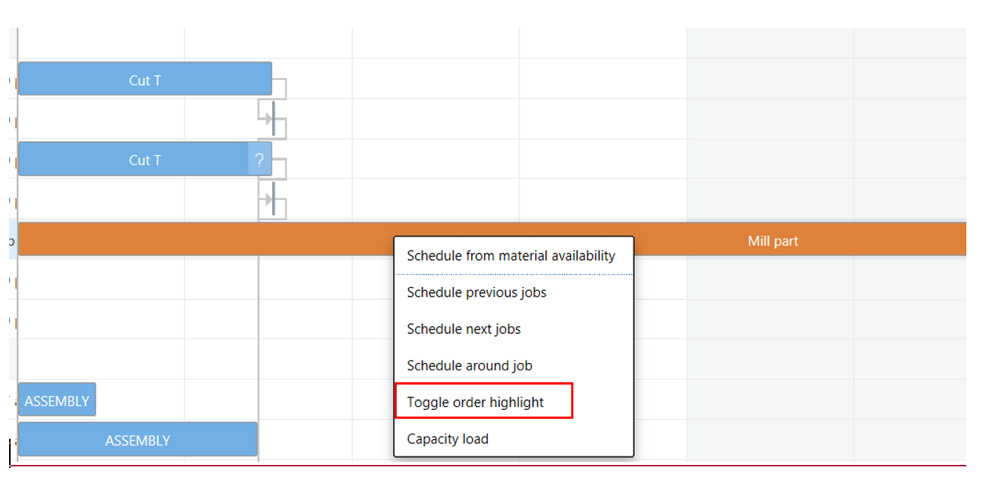
Highlight color: The highlighting is done through a menu choice in the right – click menu on a production job:
Delivery date: This is a diamond shaped marker that indicates the delivery date of the production order. This is very useful. The delivery date is the result of the MRP explosion starting at the sales order. Because the Gantt chart only can show scheduled dates of routing operations, the delivery date of the production order needs a special symbol. Its color is decided here.
NOTE: The Active/passive node colors are only defined here. They are not being applied to the chart unless you do something on the next tab.
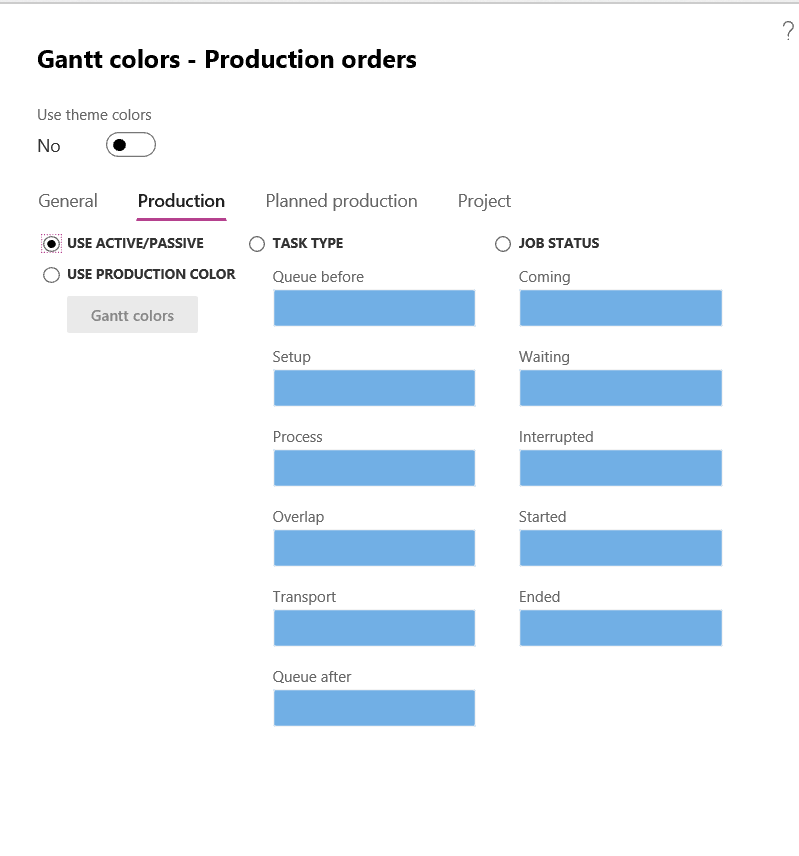
Use active/passive: If Yes the chart is going to use the active/passive node colors defined previously. If No, you can use colors per Task type or Job status.
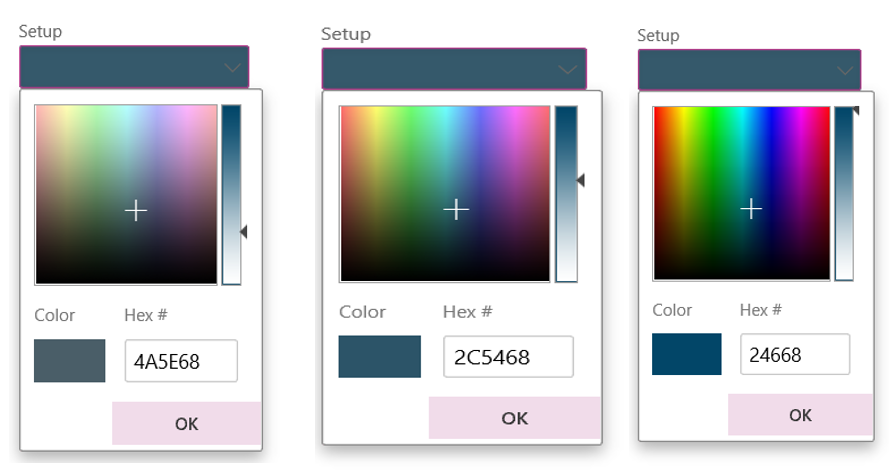
When choosing colors per Task type, do not forget to use the slider on the right of the color matrix that controls the brightness of the colors. I would ever use the faded colors you get when the slider goes down but for the watercolor- fans I guess it could be a winner.
A fourth option is “use production color.” What is “production color”?
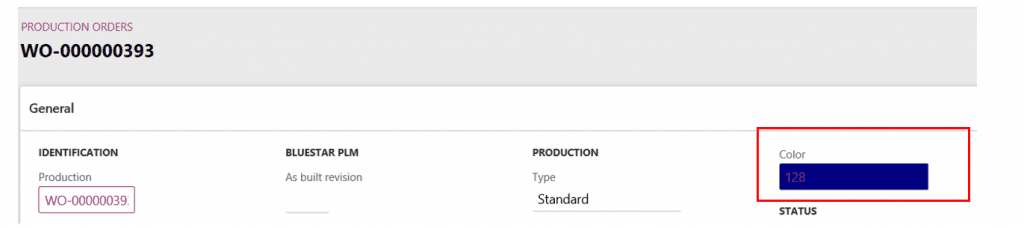
This is the production color. Each production order has a color that is assigned automatically. It can also be manually set. If you open the color pick list, you get this:
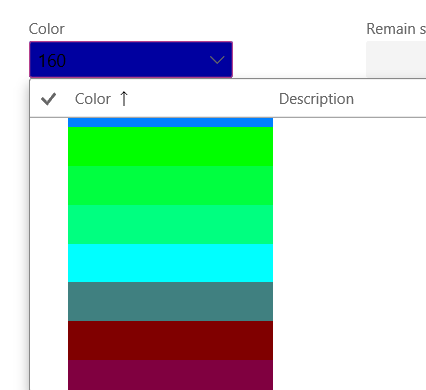
Not very handy to select a color this way. There is a better way.
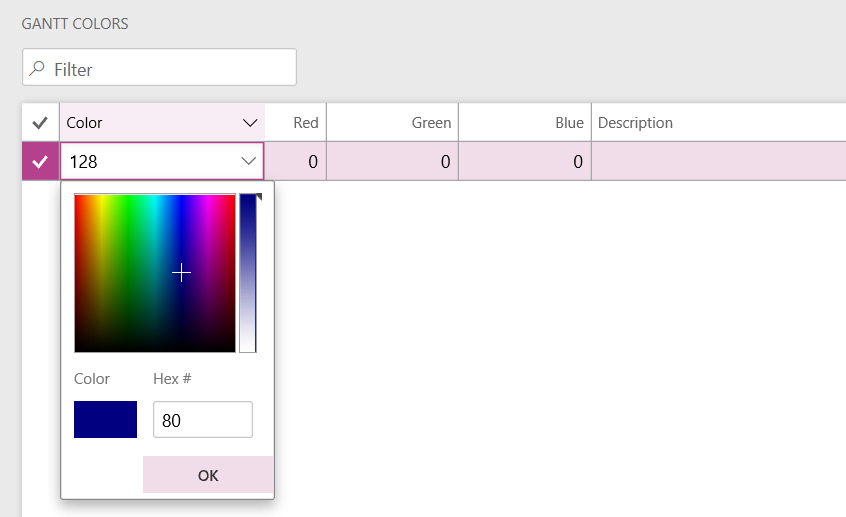
If you click on the color number, then click “Edit” and open the pick list, you get this:
The system auto-assigns each production order a color using the following rule (thanks Tim Satrom and Johan Hoffmann):
| The colors are divided into 32 different color codes.
If the production order number is an integer, then the color will be selected from the color code “list” in a subsequent order 1,2,3…32 for each order created. When reaching the last color code number (32), then the color for the first color code number (1) will be taken again and so forth. If the production order contains an alphanumerical value (like in the demo data), then the color with color code (1) is always used. |
We continue the color parameters exploration. We are done with the Production order options. Planned production orders is next.
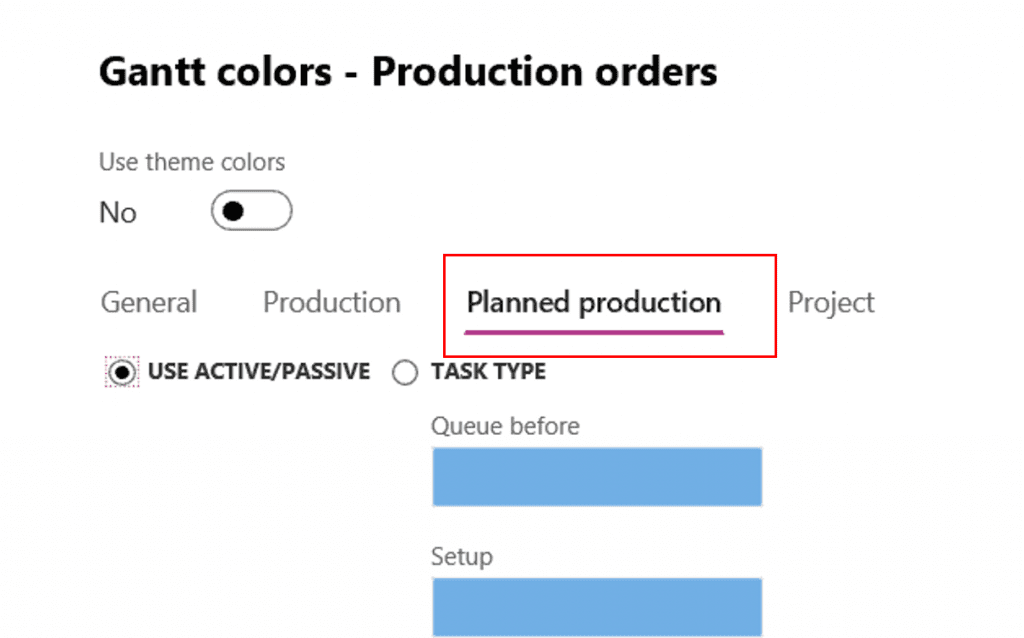
For planned production orders we can have only two of the four choices of the previous tab, because there are no production orders that have their colors or scheduled production orders that have jobs yet.
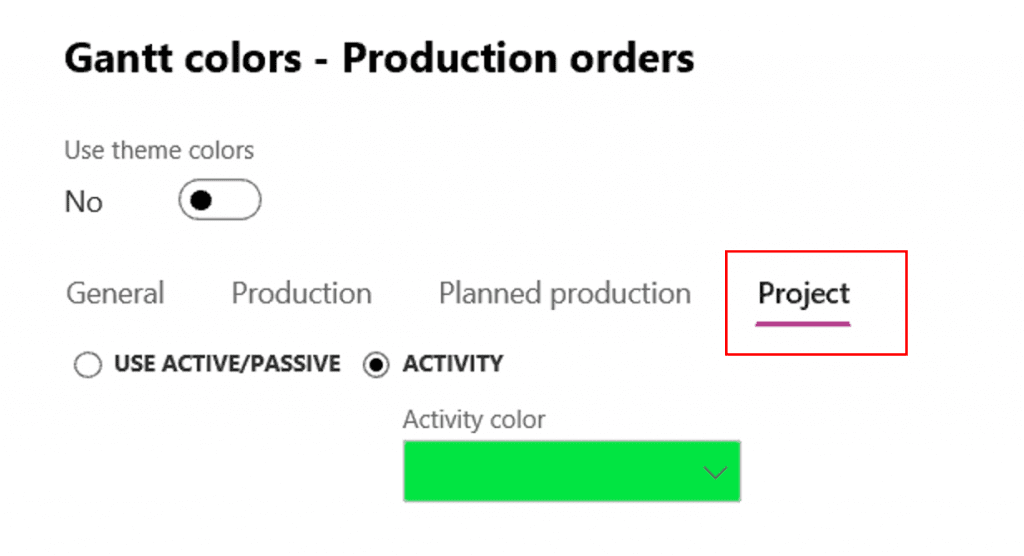
For projects we have Project Activities that will show in the Gantt chart. How would I ever see project activities in a production Gantt chart? There is only one way: I have to create Hourly project forecasts and schedule them on a manufacturing Resource group or resource. Let’s check how to do that.
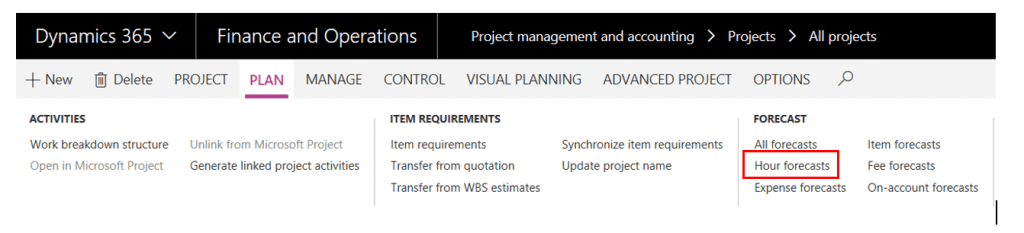
Once on projects, in the “PLAN” area, you will find Hour forecasts.
Project hourly forecasts have two options for resources. You can assign project resources, which we will not talk about there, or you can assign manufacturing resources using the “Resource requirements.” It works just like for routings in Production orders. See below.
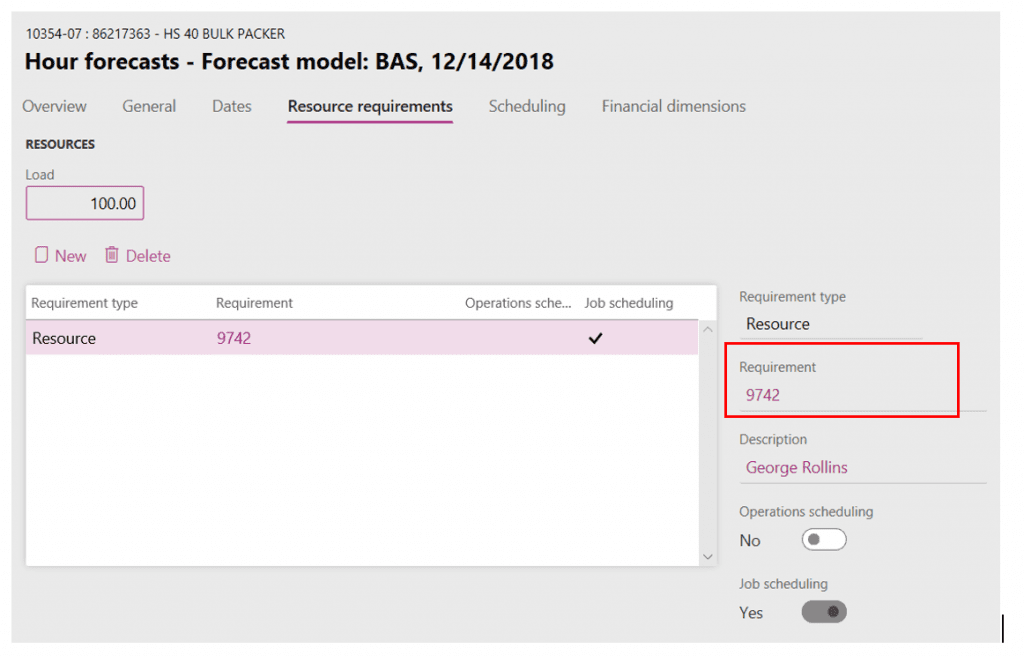
The resource or resource group is assigned in the right half of the screen.
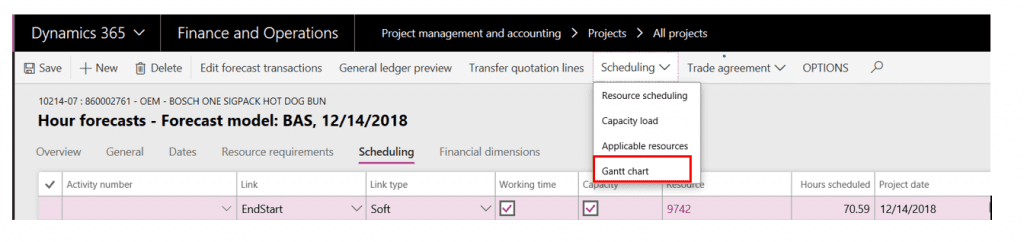
In the Project hour forecasts screen the Scheduling menu also contains the Gantt chart.
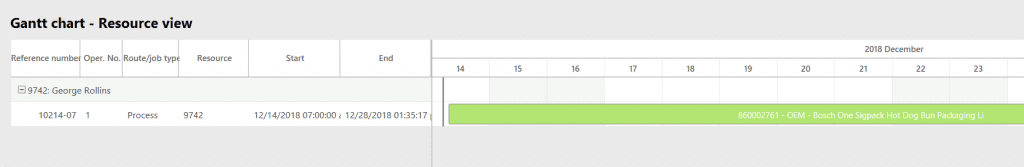
The “Active/passive” node works exactly like it does for Production orders.
The red project activity is the project I am currently on.
To display production order operations and project activities together for the same resource, you have to check the “Content” parameters.
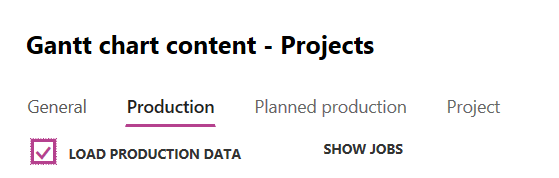
When in a project, “Load production data” should be checked. TIP: Sometimes you have to uncheck and check it to activate the data loading.
When in production orders, you do the same with the “Project” data.
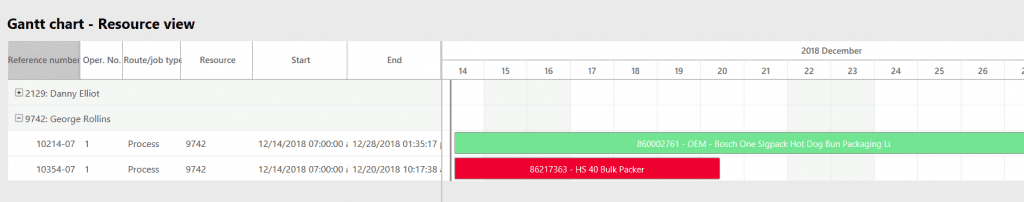
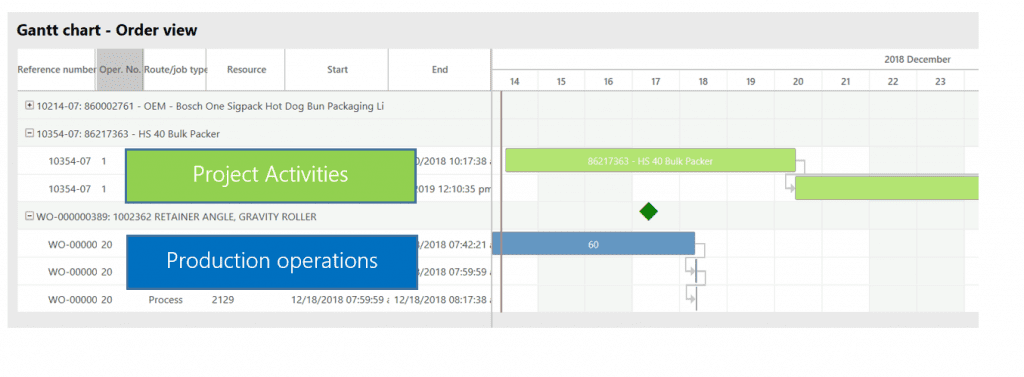
Below you will see a combination of project activities and production operations for the same resource in the Gantt chart below.
This publication contains general information only and Sikich is not, by means of this publication, rendering accounting, business, financial, investment, legal, tax, or any other professional advice or services. This publication is not a substitute for such professional advice or services, nor should you use it as a basis for any decision, action or omission that may affect you or your business. Before making any decision, taking any action or omitting an action that may affect you or your business, you should consult a qualified professional advisor. In addition, this publication may contain certain content generated by an artificial intelligence (AI) language model. You acknowledge that Sikich shall not be responsible for any loss sustained by you or any person who relies on this publication.