







Key takeaways
Sikich’s read on Q3 2026: a pause in U.S. healthcare dealmaking, not a reversal. After a strong first half, activity slowed in Q3, but the underlying market remains active and increasingly selective by buyer, subsector and asset quality.
- 2026 remains on track for a strong finish. Despite the Q3 slowdown, first-half activity has healthcare M&A positioned to surpass 2025, with our base case pointing to the strongest year since 2021.
- Strategics have the advantage as financing gets harder. They are driving the largest transactions, particularly in biopharma, while higher borrowing costs are making leveraged deals more difficult and pulling back private equity (PE) activity.
- Healthcare M&A is increasingly a market of haves and have-nots. Biopharma and medtech remain active, and hospitals and senior care are consolidating, while health IT and many physician and outpatient categories have slowed amid reimbursement, regulatory and financing uncertainty.
- Scale and earnings quality increasingly determine value. Healthcare multiples have moved lower, but larger, more profitable targets still command premiums. For sellers, payer diversification, clean billing and compliance, reimbursement visibility and defensible EBITDA are increasingly important.
- Q4 should remain active, but selective. Higher rates, approaching Medicaid changes and continued regulatory scrutiny are likely to weigh most heavily on leveraged and reimbursement-sensitive transactions, while well-positioned assets should continue to attract buyers.
Q3 by the numbers
Healthcare M&A totaled $66.5 billion in Q3 2026, down 48% from Q2’s $128.5 billion but up 17% from Q3 2025.
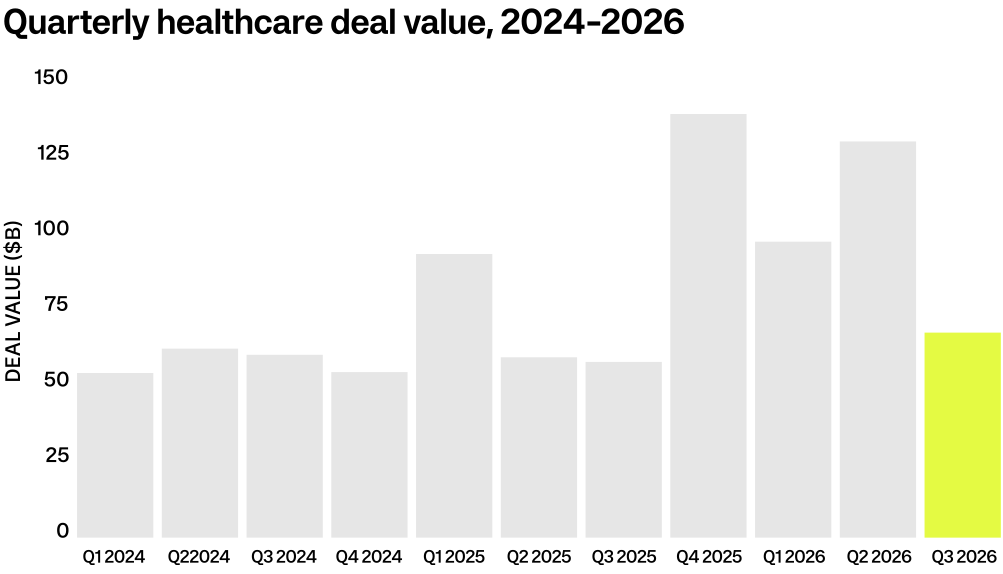
H1 did the heavy lifting. Year-to-date value reached $291 billion, already 84% of 2025’s full-year total of $344.9 billion.
Reported deal count fell to 311 from 439 in Q2, but PitchBook’s latest-quarter counts lag and are revised upward as deals are logged, overstating the slowdown. Deal value is therefore the cleaner measure of Q3 activity.
Market backdrop
Three forces shaped Q3: rising rates, approaching federal reimbursement cuts, and sustained regulatory scrutiny.
Rates turned against leverage
The Federal Reserve raised its target range to 3.75%–4% on September 16, its first increase since July 2023. Higher financing costs weighed on leveraged buyers, while cash- and stock-funded strategics took most of the largest deals.
Medicaid changes are approaching
The One Big Beautiful Bill Act is projected to reduce federal Medicaid spending by more than $900 billion over 10 years. Work requirements and six-month eligibility checks for expansion adults start December 31, 2026, while caps on state-directed payments and tighter provider-tax limits in expansion states follow in 2028. Behavioral health, maternity and long-term care are particularly exposed because of their Medicaid-dependent payer mixes. PitchBook cites this uncertainty as the main reason large buyers avoided services assets in Q3.
Antitrust scrutiny remains active
The FTC formed a Healthcare Task Force in March 2026 to coordinate competition and consumer-protection work across the sector. In January, a court granted the FTC a preliminary injunction that ended Edwards Lifesciences’ $945 million bid for JenaValve. The largest pending provider deal, Sutter Health’s combination with Allina Health, is under review by the FTC, DOJ and Minnesota’s attorney general.
Pricing and trade policy add friction, not a freeze
Drug-pricing policy, pharma tariffs and U.S.–China tensions are reshaping rather than stopping biopharma deals, pushing more value into contingent value rights and milestones. In medtech, the pending Section 232 review of medical devices and lapsed USMCA renewal are now standard in supply-chain diligence.
Sector deep dives
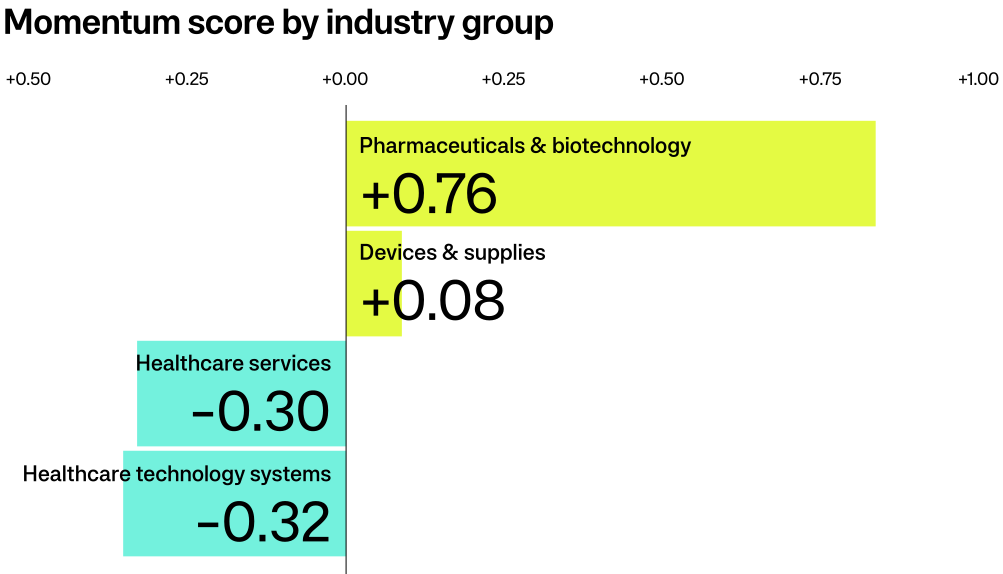
Q3 split healthcare in two: drug and device buyers kept spending, while services and health IT buyers waited out reimbursement and financing risk.
Pharmaceuticals and biotech
Biopharma was the quarter’s engine, with $39 billion across 15 announced Q3 deals, down from a record Q2. The year already has 40 acquisitions above $1 billion, a full-year record with a quarter remaining.
Deal highlights:
- Vertex agreed to buy endocrinology developer Crinetics for $10 billion in cash, a 102% premium and Vertex’s largest deal.
- Eli Lilly agreed in July to acquire AtaiBeckley, a clinical-stage mental-health developer, for $3.8 billion.
- AbbVie closed its $10.9 billion acquisition of immunology developer Apogee Therapeutics.
The driver is structural: more than $300 billion of branded revenue loses exclusivity this decade, while large biopharma holds a record estimated $2.1 trillion in deal capacity. Balance-sheet funding should keep bolt-on acquisitions resilient even as rates rise.
Medtech and life sciences tools
Medtech is shifting from megadeals toward mid-size and sponsor transactions. EY counts about $130 billion of U.S. and European medtech M&A in the 12 months to June 2026, more than triple the prior period, while average EV/EBITDA multiples fell from 17x to 13.1x. PwC puts H1 2026 medtech deal value at $36.5 billion.
PE drove Q3 activity. KKR’s $5.7 billion take-private of Integer Holdings was the quarter’s largest healthcare buyout, followed by Apax’s $1.7 billion carve-out of Gerresheimer’s Centor packaging unit. Strategics face greater scrutiny following the FTC’s January injunction that ended Edwards’ JenaValve deal.
Healthcare IT and digital health
Health tech is the weakest corner. PitchBook’s healthcare technology systems group posted a 35% three-month decline in deal count and healthcare’s lowest momentum score. H1 health IT activity totaled 121 deals worth $5 billion, down 9% in volume and 65% in value year over year. GE HealthCare’s $2.3 billion purchase of Intelerad was the largest.
Buyers are favoring acquisition targets with proven, deployed products and recurring revenue over those still selling a road map.
Payers and managed care
Payer M&A remains quiet. H1 payer deal volume fell 22.7% year over year, while managed care and value-based care multiples have compressed. Stronger-than-expected 2027 Medicare Advantage rates provide some support, but the Congressional Budget Office projects ACA marketplace enrollment falling from 22.4 million in 2025 to 13.1 million in 2027.
Providers and services, by specialty
Provider M&A split along a clear line: hospitals and senior care are consolidating faster, while sponsor-led physician and outpatient roll-ups have slowed sharply.
Hospitals and health systems are having their busiest year since the pandemic
Kaufman Hall counted 16 announced hospital deals in Q3, in line with a year earlier, with $8.2 billion in combined seller revenue and two mega-mergers where the smaller party had more than $1 billion in revenue. Fifty-six deals were announced through September, versus 46 in all of 2025. Financial pressure is contributing: three of 16 Q3 sellers were distressed, five deals were divestitures, and the August median operating margin index was 1.8%.
Sponsor roll-ups have slowed almost everywhere else
At the H1 run rate, PE deal counts are down in 12 of the 15 provider specialties below. Only vision, diagnostic labs and ABA therapy are flat or higher.
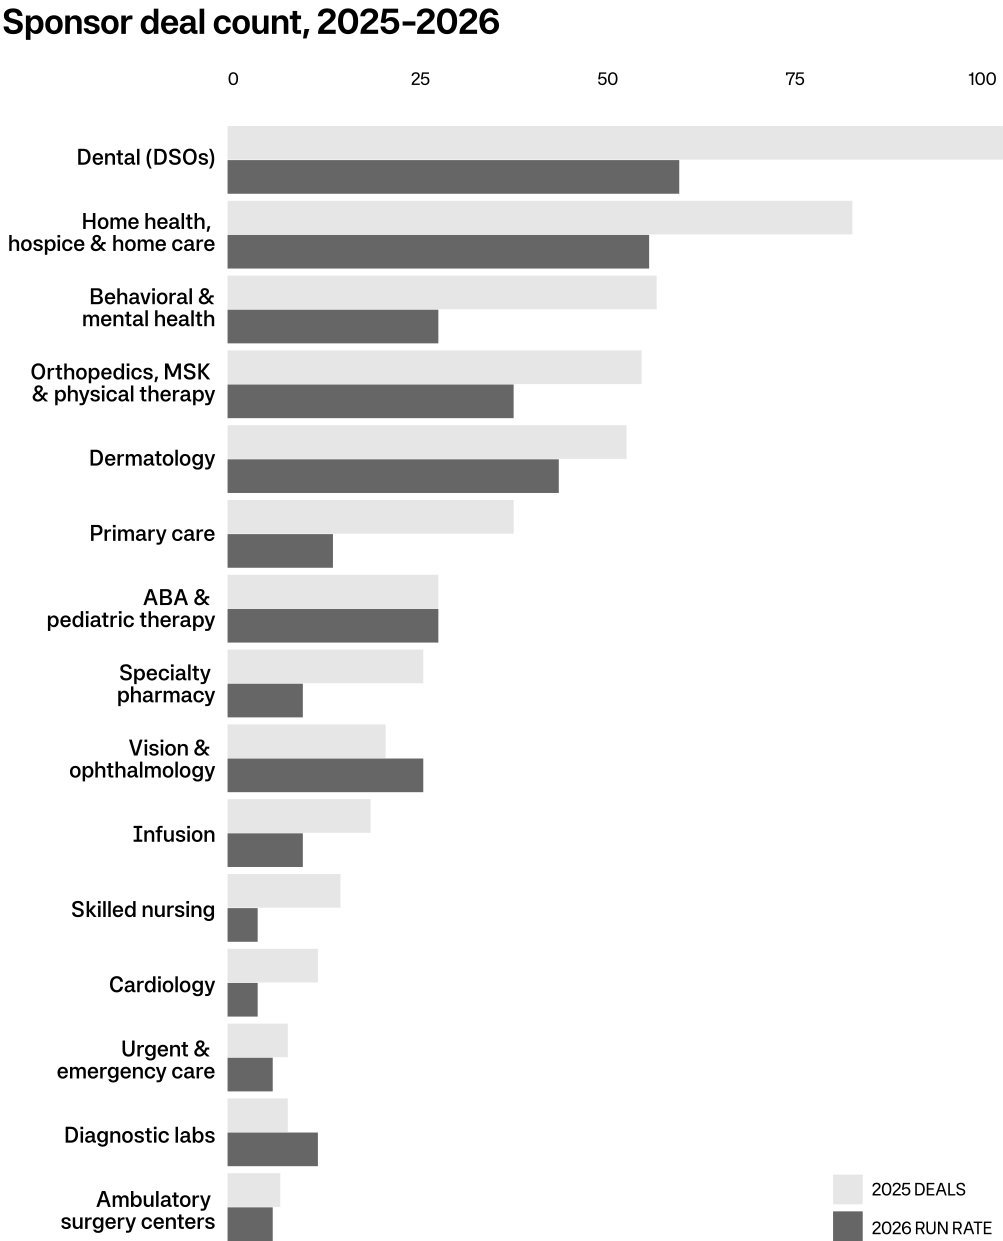
State oversight is significantly contributing to the slowdown. California’s AB 1415 requires 90 days’ notice for many PE and MSO transactions, Oregon’s corporate-practice limits took effect in January, and similar notice-and-approval bills advanced in Hawaii, Indiana, New York, Pennsylvania and Vermont.
| Sub-sector | 2026 activity | Notable 2026 deals | Direction |
| Hospitals and health systems | 16 Q3 deals; 56 YTD vs. 46 in 2025; 2 mega-mergers in Q3 | Prisma Health–Erlanger (LOI, ~$2B investment); HealthPartners–Essentia (>$12B combined revenue); Sutter–Allina (pending) | Up |
| Physician practices (all specialties) | 105 Q3 deals vs. 137 in Q3 2025 (−23%); PE in 53 of them | Dermatology rebounded to 11 Q3 deals from 5 in Q2 | Down |
| Dental (DSOs) | 51 Q3 deals, half of all physician-group deals, vs. 70 a year earlier | Imagen Dental and Heartland Dental were the most active buyers | Down |
| Ambulatory surgery centers | One of the steadier outpatient segments in sponsor data | Ascension closed its AmSurg acquisition in June; Tenet’s USPI added seven ASCs for $125M | Stable |
| Urgent and emergency care | A pocket of strength in generalist providers; PE run rate 6 vs. 8 in 2025 | — | Stable |
| Long-term care, skilled nursing, senior living | 201 deals in Q3; 614 YTD, on track for a record year | Seven portfolios of 10+ assets in Q3, six of them skilled nursing | Up |
| Home health and hospice | Q2 closings fell to 16 from 29 a year earlier | Kinderhook–Enhabit (~$1.1B, take-private); General Atlantic–TEAM Services (~$3B) | Mixed |
| Physical therapy and MSK | PE run rate 38 vs. 55 in 2025; PT platforms among the oldest PE holdings | — | Down |
| Pharmacies (specialty, infusion) | PE run rate down to 10 from 26 (specialty) and 19 (infusion) | Across all buyers, home infusion and specialty pharmacy deals are on pace for a 10-year high | Down |
| Pharmacy benefit managers | Few deals; FTC settlement with a large PBM over rebates in February | Abarca Health and LucyRx agreed to merge in June | Regulatory overhang |
| Managed care organizations | H1 payer deal volume −22.7%; public payer stocks up a median 31% in H1 on better medical-cost ratios | — | Down, improving |
| ACOs and value-based care | Little M&A; public value-based care stocks up a median 61% in H1 on Medicare Advantage outlook | Humana–MaxHealth (~$1B) | Recovering |
| Behavioral health | Mental-health PE run rate halved to 28; ABA and IDD care steady | UHS–Talkspace (~$0.84B, closed) | Down, ABA steady |
| Diagnostic labs | PE run rate 12 vs. eight in 2025 | Tempus–Personalis (~$1.5B EV) | Up |
PE
Sponsors invested $27.5 billion across 198 healthcare deals in Q3 2026, up 33% in value from Q2 but down 15% from Q3 2025.
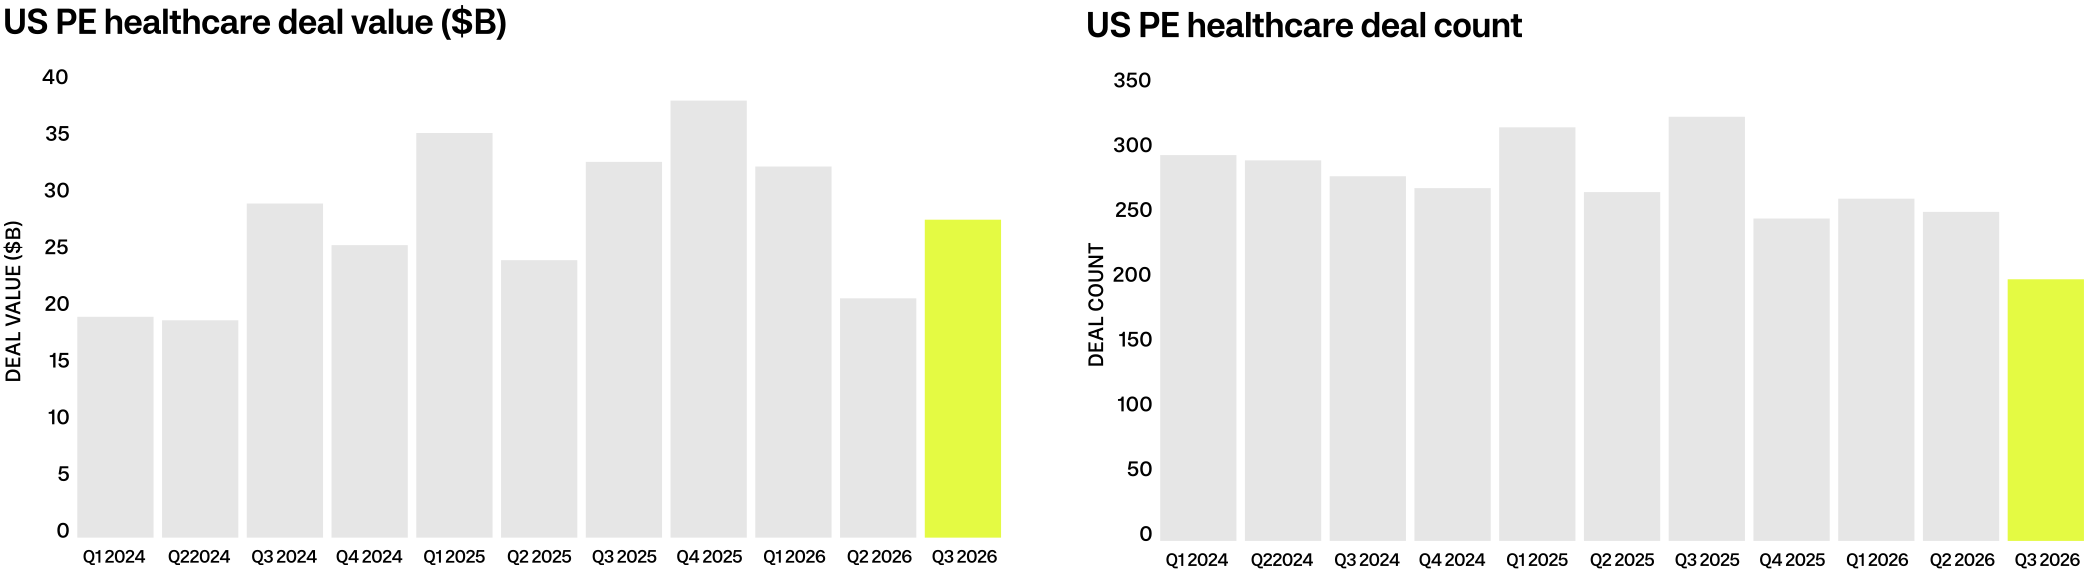
Year to date, healthcare PE deals total $80.3 billion across 706 transactions, about 12% of PE deal value. That’s down 12% in value and 21% in count from the first nine months of 2025.
Fewer, larger deals defined the quarter. KKR’s $5.7 billion take-private of device-component maker Integer Holdings was the largest, while carve-outs filled much of the rest, including Apax’s $1.7 billion purchase of Gerresheimer’s Centor packaging unit and Yellow Wood Partners’ $1 billion deal for Nestlé’s Holistic Health Platform.
Financing tightened mid-quarter. The Fed raised its target range by 25 basis points to 3.75%–4% on September 16, its first hike since July 2023, with the median projection signaling another in 2026. PitchBook expects higher borrowing costs to weigh on Q4 volume, particularly for megadeals.
Exits held steady. Sponsors exited 31 healthcare companies for $15.5 billion in Q3, bringing the 2026 total to 111 exits worth $45.7 billion, compared with $49 billion in the first nine months of 2025.
Middle market
Healthcare’s middle market is holding its value but losing volume. In H1 2026, sponsors closed 175 deals valued between $25 million and $1 billion, totaling $21.1 billion. Compared with H1 2025, deal value fell about 5%, while deal count declined about 25%.
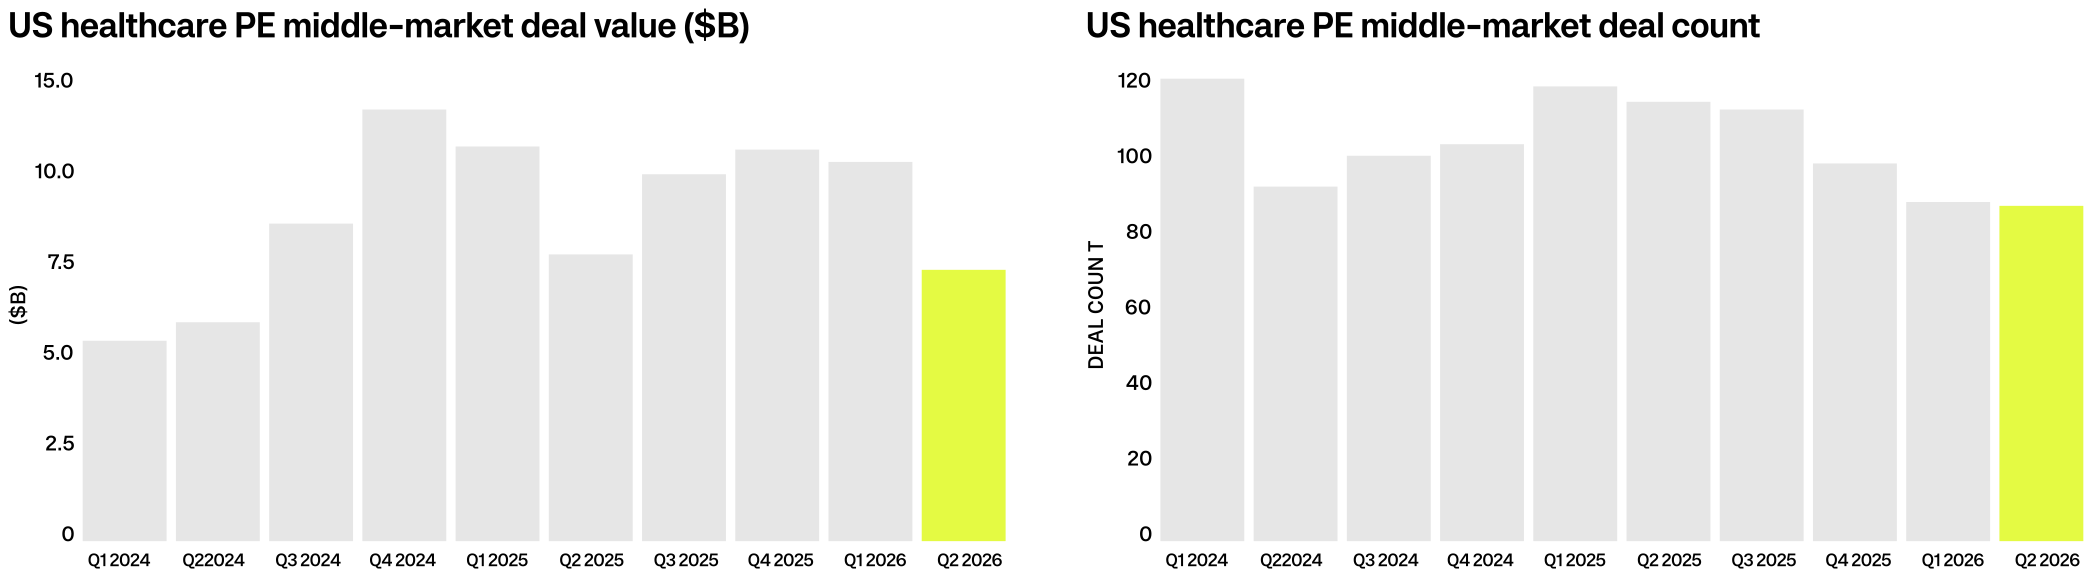
Sponsors are moving down-market. Middle-market deals accounted for 50.4% of PE buyout value in H1 2026, up from 45.7% in 2025, as megadeals became harder to finance. Healthcare’s share of middle-market deal value held at about 12%, in line with its share of PE overall.
Deals are getting smaller at the median. The median middle-market PE deal fell to $151.9 million in 2026 from $179 million in 2025, while the average edged up to $268.6 million. That suggests the market is thinning in the middle rather than shrinking at the top.
Exits are slow. Sponsors exited 47 middle-market healthcare companies for $7.6 billion in H1 2026, compared with 115 exits worth $18.6 billion in all of 2025, keeping a backlog of aging portfolio companies headed to market in 2027.
| Lower middle market (TEV $10M–$250M) | 2025 | H1 2026 |
| Healthcare services, average EV/EBITDA | 8.5x | 7.7x |
| All industries, average EV/EBITDA | 7.2x (2024–25 avg.) | 7.1x |
| TEV $10M–$50M vs. $50M–$250M | — | 6.8x vs. 7.6x |
| Strategic vs. financial buyers | 8.1x vs. 7.3x | 8.5x vs. 7.2x |
| Total debt / EBITDA, platform buyouts (Q2) | — | 2.9x |
Our read: the gap between roughly 7.7x for lower-middle-market healthcare services and 11.6–13.6x for larger healthcare deals shows the size premium in action. For owners of businesses with $3–10 million of EBITDA, the clearest path to a higher multiple is greater scale and earnings quality through add-on growth, payer diversification and clean billing, rather than waiting for rates.
Valuation multiples and EBITDA size
Headline healthcare multiples are down from their 2024 peak, but buyers are paying more for larger, more profitable targets, making EBITDA size increasingly important to price.
Market-level multiples are lower. PitchBook’s median healthcare M&A multiple fell from 14.5x EV/EBITDA in 2024 to 13x in 2025 and 11.6x year to date in 2026. The trailing-12-month median of 12.7x still leads every sector. Median EV/revenue held at 2.4x.
Target EBITDA is getting bigger. The median PE-backed healthcare services company was bought at 13.6x EBITDA in 2025, essentially flat from 13.5x in 2024, while implied EBITDA rose about 27% to roughly $33 million as revenue and margins climbed. Entry leverage edged up to 5.2x.
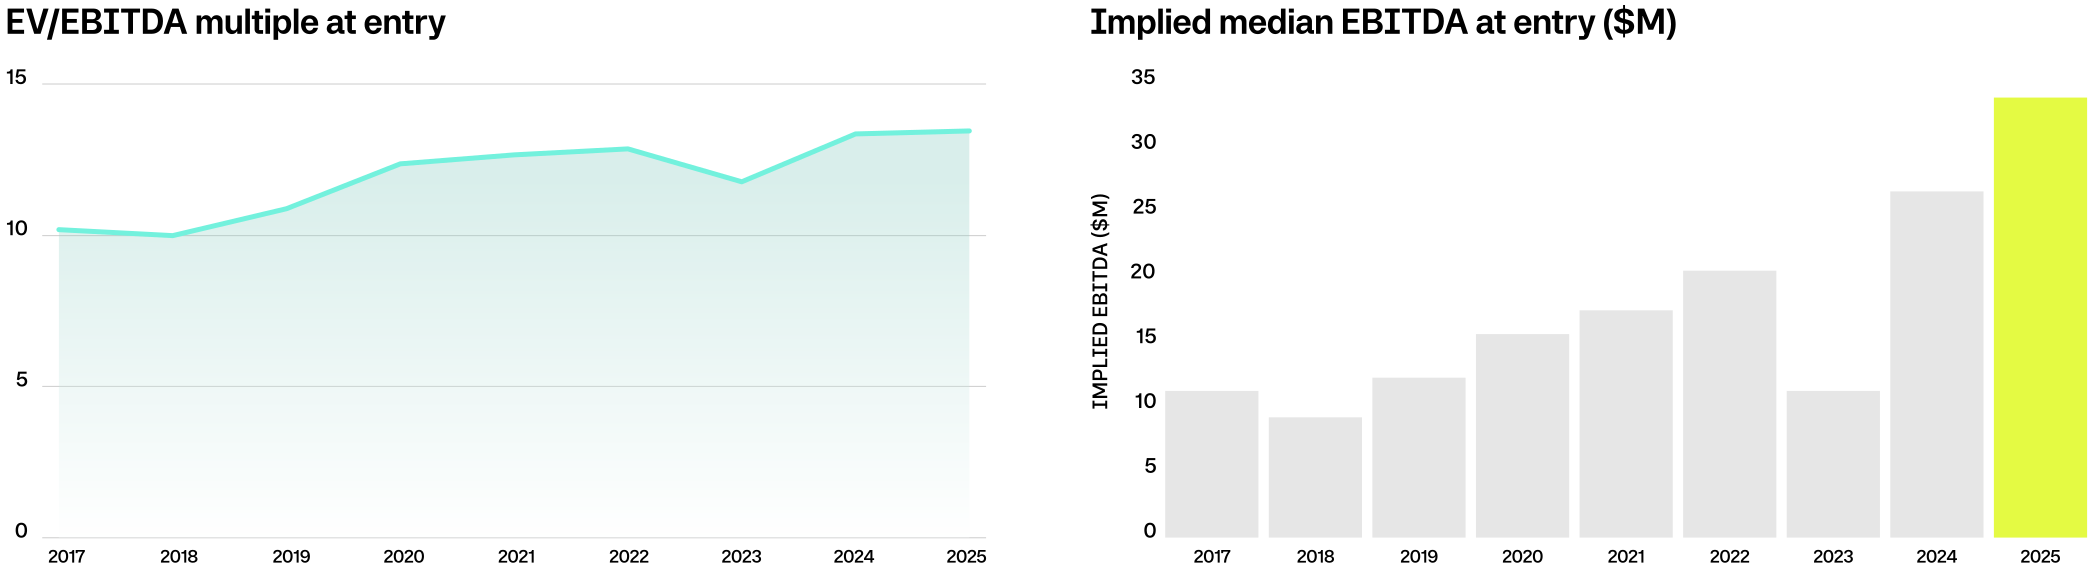
Hospitals show the same pattern: the average Q3 seller had about $586 million in revenue, up from $401 million a year earlier.
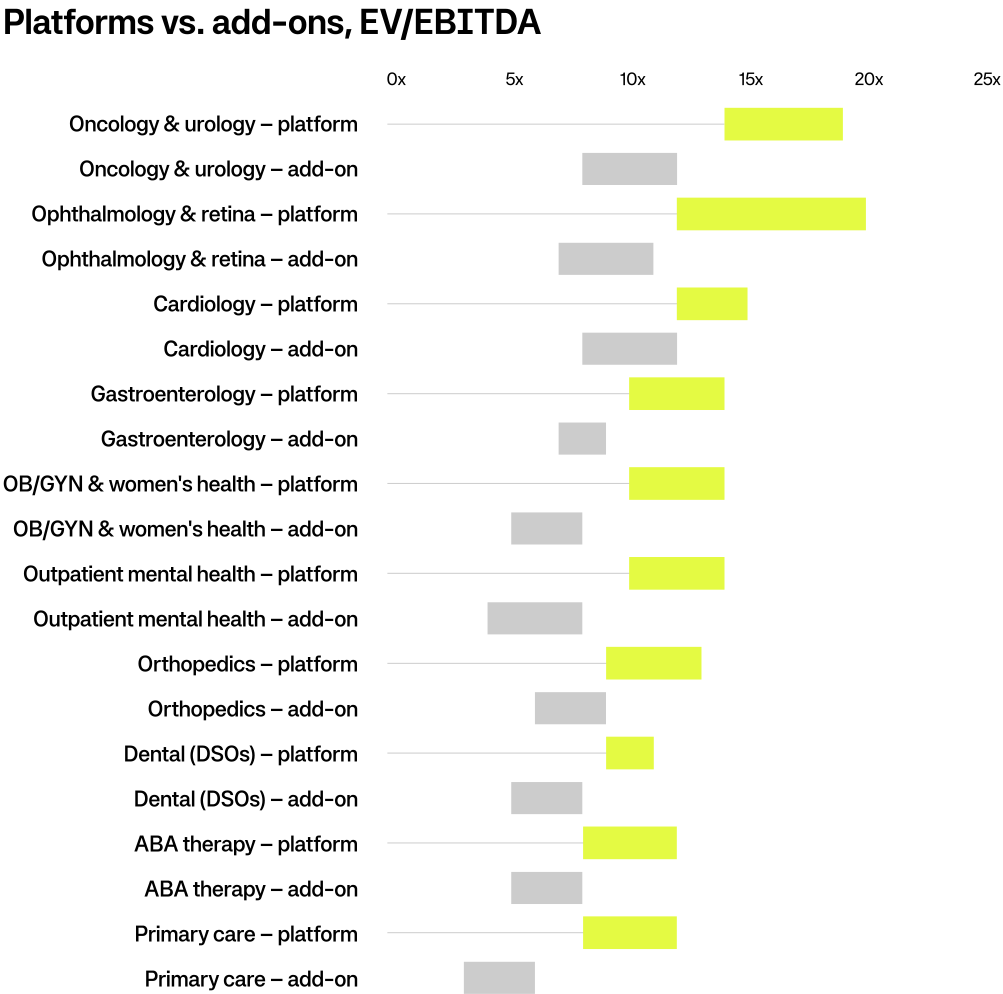
The size premium is steep. Physician practice multiples rise from 5–7x below $1 million of EBITDA to 7–9x at $1–3 million, 9–11x at $3–5 million and 11–13x above $5 million. By specialty, platforms command a four- to eight-turn premium over add-on practices.
Facility-based and other sub-sectors:
| Sub-sector | Indicative EV/EBITDA | 2026 vs. 2025 | Evidence |
| Ambulatory surgery centers | Single-specialty 5–8x; multispecialty 6–10x; regional operators 11–17x | Up | Median ASC multiple reached 7.9x in 2025, the highest in at least eight years |
| Hospitals (public comps) | ~10x long-run average; HCA 8.5x, Community Health 7.5x, Ardent 6.1x | Flat | Public comps as of June 30, 2026 |
| Senior living and skilled nursing | Priced on cap rates; SNF portfolio at ~8.6% yield | Up | Senior living cap rates compressed 25–50 bp in 2026 |
| Home health and hospice | Enhabit take-private at 10.2x; small agencies typically mid-single digits | Down | Fewer closings; buyers discount billing and compliance risk |
| Dental (DSOs) | Platforms 9–11x; add-ons 5–8x; practices 5–9x | Flat | Practice-level pricing steady for two years |
| Urgent care | 3–7x under $10M revenue; 6–11x at $10–50M; 10–15x+ scaled | Flat | Scale drives the spread |
| Behavioral health | Outpatient platforms 10–14x; UHS paid ~26x for Talkspace | Mixed | Strategic buyers paid up for digital scale |
| Healthcare IT | ~7.3x EV/revenue in 2025–H1 2026 vs. 4.6x in 2023–24 | Up | Higher-growth software targets lift averages |
| Medtech | Average EV/EBITDA 13.1x vs. 17.0x a year earlier | Down | Megadeal cycle cooled |
Our read: multiple compression is real at the top of the market, where megadeals and public comps reset. In the lower middle market, the greater risk to sellers is not a lower multiple but a lower EBITDA after quality-of-earnings adjustments for payer mix, Medicaid exposure and billing compliance.
Largest 2026 healthcare deals to date
Biopharma accounts for 11 of the 21 largest healthcare deals announced in 2026, and every deal above $9 billion went to a strategic buyer. Q3 deals are marked.
| Announced | Acquirer → target | Sub-sector | Value (EV where stated) | Status |
| Jan 15 | Boston Scientific → Penumbra | Medtech | $14.5B (~10x sales) | Pending |
| Apr 27 | Sun Pharma → Organon | Pharma | $11.75B EV (~6x EBITDA) | Pending |
| Jun 25 | Merck KGaA → Bio-Techne | Life-science tools | $11.3B EV | Pending |
| Jun 22 | AbbVie → Apogee Therapeutics | Biotech | $10.9B equity | Closed Sep 3 |
| Jun 9 | GSK → Nuvalent | Biotech | $10.6B equity | Pending |
| Jul 7 (Q3) | Vertex → Crinetics | Biotech | $10B equity | Closed Sep 1 |
| Feb 17 | Danaher → Masimo | Medtech | $9.9B (~4.3x sales) | Closed Jun 10 |
| Aug 3 (Q3) | Curium → Lantheus | Radiopharma | Up to ~$8B incl. CVR | Pending |
| Feb 23 | Gilead → Arcellx | Biotech | ~$7.8B equity | Closed Apr 28 |
| Mar 25 | Merck → Terns | Biotech | ~$6.7B equity | Closed May 5 |
| Mar 31 | Eli Lilly → Centessa | Biotech | $6.3B upfront (up to $7.8B) | Announced |
| Aug 3 (Q3) | KKR → Integer Holdings | Medtech manufacturing | ~$5.7B EV (~19.5x EBITDA) | Pending |
| Mar 31 | Biogen → Apellis | Biotech | ~$5.6B equity | Closed May 14 |
| Apr 20 | Eli Lilly → Kelonia | Biotech | $3.25B upfront (up to $7B) | Closed |
| Jul 16 (Q3) | Eli Lilly → AtaiBeckley | Biotech | ~$2.8B upfront (up to $3.8B) | Announced |
| Aug 25 (Q3) | McKesson → Precision Medicine Group | Pharma services | ~$2.25B | Pending |
| Jul 20 (Q3) | Tempus → Personalis | Diagnostics | ~$1.5B EV | Pending |
| Feb 23 | Kinderhook → Enhabit | Home health and hospice | ~$1.1B (10.2x EBITDA) | Closed |
| Mar 23 | Cencora → EyeSouth retina business | Physician practices | $1.1B | Agreed |
| Feb 13 | Humana → MaxHealth | Value-based primary care | ~$0.9–1B | Closed |
Nonprofit health-system combinations are sized by combined annual revenue:
| Announced | Combination | Combined revenue | Status |
| Oct 14 (Q4) | Rush + Endeavor Health | ~$11B, 12 hospitals | Pending |
| Sep 29 (Q3) | HealthPartners + Essentia Health | ~$12.5B, 22 hospitals | Targeting Jan 1, 2027 |
| Jul (Q3) | Prisma Health → Erlanger | ~$9B, plus $2B investment pledge | Letter of intent |
| May 21 | Sutter Health + Allina Health | ~$26B | Pending regulatory review |
Values are headline figures from deal announcements; contingent value rights and milestones are noted where they inflate the headline. Multiples are reported or derived from reported EBITDA and revenue.
Outlook: Q4 and full-year 2026
Our base case puts 2026 healthcare M&A at about $377 billion, roughly 9% above 2025 and the strongest year since 2021, even if Q4 only matches the 2025 quarterly average.
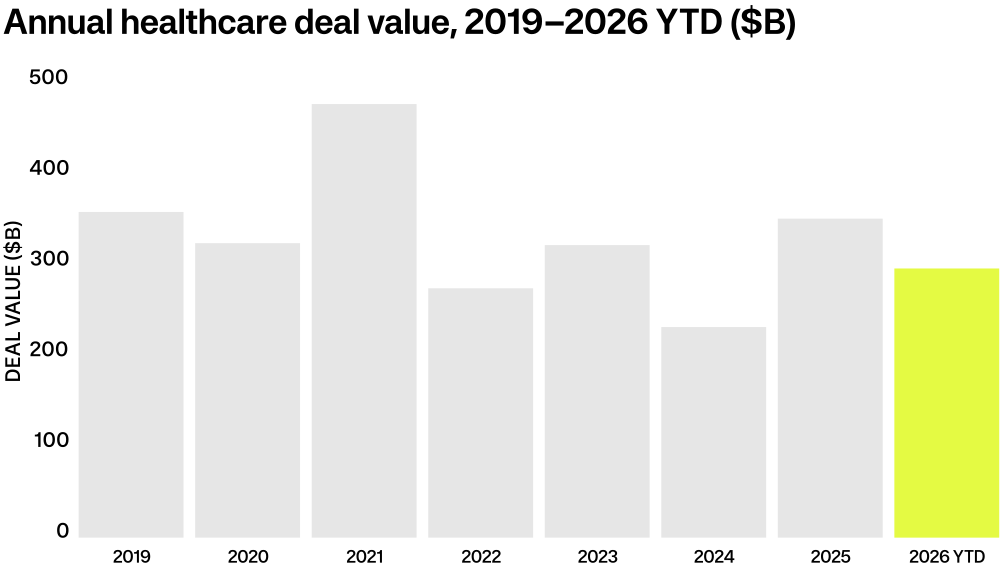
The downside is limited because the first half is already banked. Repeating Q3’s pace would put the year near $358 billion. Matching 2025’s megadeal-heavy Q4 would lift it to about $428 billion. PitchBook’s own global projection, barring another quarter like Q3, is roughly 4,226 healthcare deals worth $569.1 billion for 2026.
PE is the weak side of the forecast. At Q3’s pace, healthcare PE deal value would reach about $108 billion in 2026, roughly 17% below 2025’s $129.3 billion. The September rate hike and at least one more expected increase also raise the cost of every leveraged bid.
What we expect by sector through year-end:
- Pharma and biotech: Continued $1 billion-plus bolt-on acquisitions as patent cliffs approach, funded from balance sheets rather than leverage, plus more sponsor carve-outs of noncore assets.
- Medtech: Fewer megadeals, more take-privates and carve-outs, and portfolio pruning by large strategics.
- Providers and services: Selective activity in behavioral health, specialty physician platforms, ASCs and senior care, plus health-system divestitures and distressed sales as Medicaid work requirements approach on December 31.
- Health IT: Targeted capability buys, such as revenue-cycle and analytics tools, rather than platform consolidation.
- Payers: Little M&A until 2027 rate and enrollment effects are clearer.
Sellers should prepare now rather than wait for rates to fall. Buyers are paying for earnings quality, clean billing and compliance, and visible reimbursement. Assets demonstrating those strengths can still clear in Q4, while marginal assets face longer processes and wider bid-ask spreads.
Watch list for Q4:
- Remaining Fed decisions and whether a second 2026 hike lands
- A ruling or settlement on Sutter Health–Allina Health, targeted to close by year-end
- CMS implementation of Medicaid work requirements and state requests for delays
- The Section 232 medical-device review and any resulting tariffs
This publication contains general information only and Sikich is not, by means of this publication, rendering accounting, business, financial, investment, legal, tax, or any other professional advice or services. This publication is not a substitute for such professional advice or services, nor should you use it as a basis for any decision, action or omission that may affect you or your business. Before making any decision, taking any action or omitting an action that may affect you or your business, you should consult a qualified professional advisor. In addition, this publication may contain certain content generated by an artificial intelligence (AI) language model. You acknowledge that Sikich shall not be responsible for any loss sustained by you or any person who relies on this publication.