


The Microsoft Dynamics AX safety stock journal provides useful issue history statistics for an item that helps calculate a new minimum inventory level based on reliable metrics. But even when the intent is not to calculate a new minimum, safety stock can provide a structure in which to regularly review issues related to item history and changing conditions.
This article will explore the setup of the safety stock journal as designed in either Dynamics AX 2012 R3 or the new AX. Screen shots used here are from AX 2012 R3.
In order to work with the safety stock journal, items need to have at least 3 months of historical data. With less, the calculation of new minimum is not considered meaningful.
Navigate to Master Planning>Area Page>Journals>Safety Stock and click on Safety Stock. Don’t click “new”, better click “Create new” which puts you directly into the lines screen. If no default Journal name is available, right click on the Name column and select View Details to create a journal name. Now click on Lines.
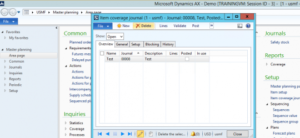
We never create manual lines in a Safety stock journal. We let the system create lines. That is the first step.
STEP 1
The system checks history for each item in each site/warehouse and calculates the average issue quantity per month, including a standard deviation. Using lead time, it calculates the average issue during lead time. Then it calculates the dollar value of current minimum value for that item. (the title of the field is misleading. It has nothing to do with the current on-hand of the item)
Click on Create lines once you are in the empty lines screen.

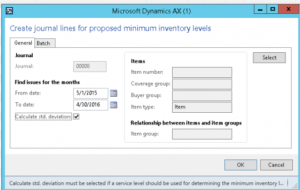
You could click on the Select button if you are only interested in certain items. Most likely you want to run this for all items.
After you have put in your historic date range (you have to use start of month and end of month dates), click the checkbox “calculate std. deviation”. This is recommended because this standard deviation gives an indication how variable your historic demand has been. Click OK.
Standard deviation is a number used to indicate how measurements, in this case, average number of issues of an item per month, are spread out from the average. A low standard deviation means that most of the numbers are very close to the average. A high standard deviation means that the numbers are spread out around the average.
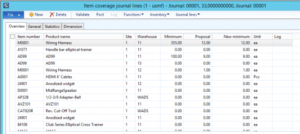
You will get a list of items (it could be a few minutes waiting time if you have many items and many historic transactions). The same item showing multiple times can only mean that the item has historic consumption in multiple sites and/or warehouses.
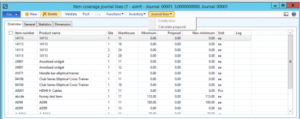
By clicking on the “Avg issues per month” column you can sort to get a ranking of most issued to least issued items.
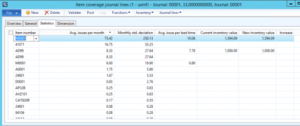
Please verify the numbers for a few items in the column “Avg. issues per month”. Simply calculate the grand total of issues for an item in a warehouse by checking all the inventory transactions and make sure to only look at the time period you indicated. The time period is always a whole number of calendar months. Divide your grand total issued quantity for the period by the number of months. You should get the result showing in the Safety Stock journal column “Avg. issues per month”.
NOTE 1: The system takes all inventory transactions with issue status ‘Deducted” or ‘Sold”, with exception of any transfers.
NOTE 2: Return sales orders are NOT reducing the total “issued” quantity for an item.
The number one item with the most issues per month is M0001. A large standard deviation means that the issued quantities are very variable. One could have months of nothing and then suddenly a large quantity. That is indeed the case with M0001.
At this moment, the system has NOT calculated any new “minimum” yet.
NOTE 3: If the column “Avg. issue per lead time” is empty, it simply means the item has no lead time.
NOTE 4: The columns “current inventory value” and “new inventory value” are equal at this moment because we do not have a new minimum yet that would be dollarized in the field “new inventory value”. (field name also misleading. It is the total cost amount of the new minimum quantity)
STEP 2
The system calculates a new minimum using the method the user selects.
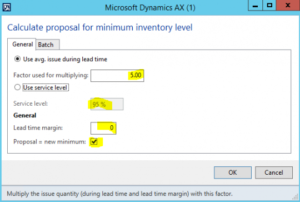
Click on Calculate Proposal.
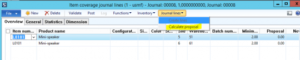
The system offers two methods to calculate a new minimum, the first one being the most commonly used.
Edit the multiplying factor or, when using the service level method, enter service level.
The service level factor is derived from the service level using the following table:
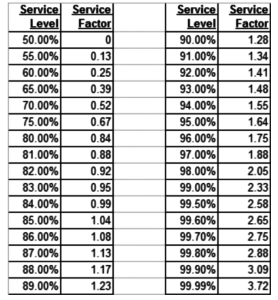
Alternative: using Excel ‘s statistical function NORMS.S.INV we can find the service factor for each service level.
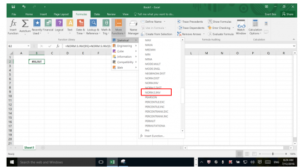
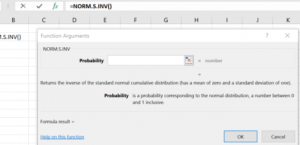
Enter the service level as a number between 0 and 1!
A service level of 95% would be entered as 0.95.
A lead time margin can be added to either method to beef up the result as required. (your proposed new minimum will get higher)
Check Proposal = new minimum only if you want the results of the calculation to become the new Minimum. Click OK.
A new minimum will be calculated for all items in the journal. (or more precise: for each site/warehouse combination where this item lives. (Only if I have checked “item coverage” for site and warehouse in the Storage dimension group) At this moment, nothing has changed in the system yet. We are working in a journal.
Now the system has created “proposal” quantity and copied that value to the “new minimum” field.
You can manually override the value in the “new minimum” field. Still nothing has happened in the system.
Only after we Post this journal will the minimum quantity of all items in the journal be updated to the value in “new minimum”.
Why do we see so many zeroes in the proposal column? That can have two reasons!
Warning 1: If the item has no minimum right now, the system will NOT calculate a proposal for a new minimum.
Warning 2: If the item has no lead time, the system will NOT calculate a proposal
Conclusion
The use of a safety stock (minimum inventory level) for an item requires regular review of the issue history of items as conditions change.
This is a very useful feature that deserves to be more widely known. It provides useful issue history statistics for an item, even when the intent is not to calculate a new minimum.
This publication contains general information only and Sikich is not, by means of this publication, rendering accounting, business, financial, investment, legal, tax, or any other professional advice or services. This publication is not a substitute for such professional advice or services, nor should you use it as a basis for any decision, action or omission that may affect you or your business. Before making any decision, taking any action or omitting an action that may affect you or your business, you should consult a qualified professional advisor. In addition, this publication may contain certain content generated by an artificial intelligence (AI) language model. You acknowledge that Sikich shall not be responsible for any loss sustained by you or any person who relies on this publication.